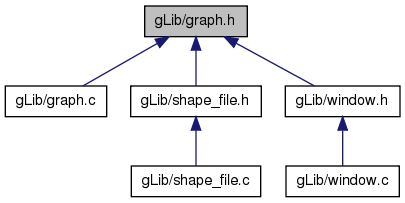
gLib/graph.h File Reference
2D & 3D グラフィックライブラリ ヘッダ More...
#include "gdata.h"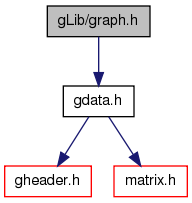
Go to the source code of this file.
Defines | |
| #define | set_around_space(vp) set_around((vp), 0) |
| #define | SetPixel(vp, x, y, cc) set_idat((vp), (x), (y), 0, (cc)) |
| #define | GetPixel(vp, x, y) get_idat((vp), (x), (y), 0) |
| #define | isCrossLine(x1, y1, x2, y2, x3, y3, x4, y4) (((x1)-(x2))*((y3)-(y1))+((y1)-(y2))*((x1)-(x3)))*(((x1)-(x2))*((y4)-(y1))+((y1)-(y2))*((x1)-(x4))) |
Functions | |
| void | local2world (WSGraph gd, WSGraph vp, vector ox, vector oz, vector ex, double *csf, double *snf) |
| void | topola (vector nv, double *cst, double *snt, double *csf, double *snf) |
| void | set_around (WSGraph vp, int cc) |
| void | bline (BSGraph vp, int xs, int ys, int xe, int ye, int c) |
| void | bline3d (BSGraph vp, int xs, int ys, int zs, int xe, int ye, int ze, int c) |
| void | line (WSGraph vp, int xs, int ys, int xe, int ye, int c) |
| void | line3d (WSGraph vp, int xs, int ys, int zs, int xe, int ye, int ze, int c) |
| void | circle (WSGraph vp, int x, int y, int r, int c, int mode) |
| void | paint (WSGraph vp, int x, int y, int mn, int mx, int c, int m) |
| void | paint3d (WSGraph vp, int x, int y, int z, int mn, int mx, int c, int m) |
| void | _paint_3d (WSGraph vp, int x, int y, int z, int mn, int mx, int c, int m) |
| void | box (WSGraph vp, int xs, int ys, int xe, int ye, int c, int m) |
| void | triangle (WSGraph vp, int x1, int y1, int x2, int y2, int x3, int y3, int c, int m) |
| void | circle3d (WSGraph vp, vector a, vector b, int rr, int cc, int mode) |
| void | sphere (WSGraph vp, vector a, int r, int c, int mode) |
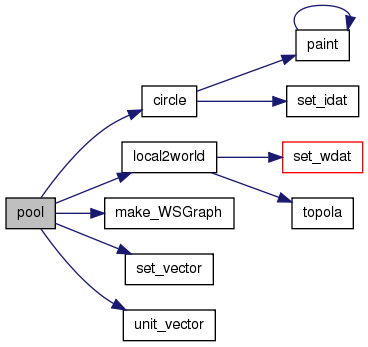
| void | pool (WSGraph vp, vector a, vector b, int rr, int c) |
| void | torus (WSGraph vp, vector a, vector b, int rr, int ra, int c) |
| WSGraph | x_reverse_wsg (WSGraph vp) |
| WSGraph | cut_object (WSGraph vp, int cc, IRBound *rb, int blank) |
| WSGraph | zoom_WSGraph (WSGraph vp, int zm, int mode) |
| WSGraph | grab_WSGraph (WSGraph vp, int x1, int y1, int x2, int y2) |
| void | copy_WSGraph (WSGraph src, WSGraph dst) |
| int | get_wdat (WSGraph, double, double, double, IRBound) |
| int | get_idat (WSGraph, int, int, int) |
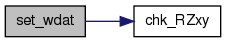
| void | set_wdat (WSGraph, double, double, double, int, IRBound) |
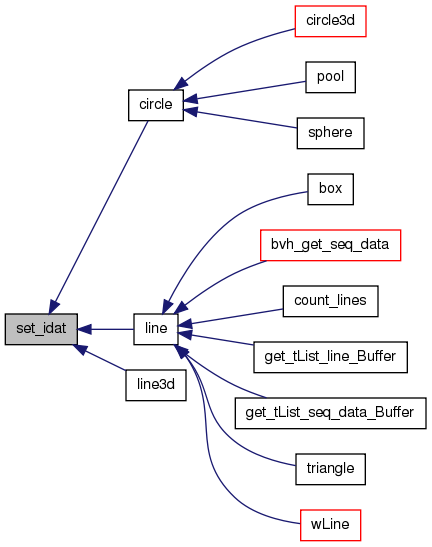
| void | set_idat (WSGraph, int, int, int, int) |
| int | get_bdat (BSGraph, int, int, int) |
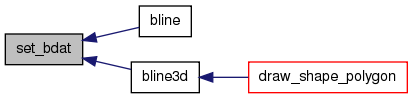
| void | set_bdat (BSGraph, int, int, int, int) |
| int | isinctri (int x1, int y1, int x2, int y2, int x3, int y3, int xx, int yy) |
Detailed Description
- Version:
- 3.0
Definition in file graph.h.
Define Documentation
| #define GetPixel | ( | vp, | |||
| x, | |||||
| y | ) | get_idat((vp), (x), (y), 0) |
int GetPixel(WSGraph vp, int x, int y);
2Dグラフィックデータ構造体 vpの任意の 1pixelの値(濃度)を返す.
座標範囲のチェックあり.
- Parameters:
-
vp 操作対象となる2Dグラフィックデータ構造体. x,y 知りたい値の xy座標.
使用例
    SetPixel(vp, 5, 5, 100);
    SetPixel(vp, 100, 100, 200);
    SetPixel(vp, 100, 200, 10);
    val = GetPixel(vp, 100, 100);  // 当然 val の値は 200
Definition at line 95 of file graph.h.
Referenced by wGetPixel().
| #define isCrossLine | ( | x1, | |||
| y1, | |||||
| x2, | |||||
| y2, | |||||
| x3, | |||||
| y3, | |||||
| x4, | |||||
| y4 | ) | (((x1)-(x2))*((y3)-(y1))+((y1)-(y2))*((x1)-(x3)))*(((x1)-(x2))*((y4)-(y1))+((y1)-(y2))*((x1)-(x4))) |
int isCrossLine(x1, y1, x2, y2, x3, y3, x4, y4);
(x1,y1)-(x2,y2) の直線と (x3,y3)-(x4,y4) の線分が交差しているか判定する
- Return values:
-
1以上 交差しない 0 3か4 は直線上にある 0未満 交差する
Definition at line 107 of file graph.h.
Referenced by isinctri().
| #define SetPixel | ( | vp, | |||
| x, | |||||
| y, | |||||
| cc | ) | set_idat((vp), (x), (y), 0, (cc)) |
void SetPixel(WSGraph vp, int x, int y, int cc)
2Dグラフィックデータ構造体 vpの任意の 1pixelに値を設定する.
座標範囲のチェックあり.
- Parameters:
-
vp 操作対象となる2Dグラフィックデータ構造体. x,y 値を設定する xy座標. cc 点(x,y)に設定する点の値(濃度).
使用例
    SetPixel(vp, 5, 5, 100);      // 座標(5,5)に 100を設定
    SetPixel(vp, 100, 100, 200);  // 座標(100,100)に 200を設定
    SetPixel(vp, 100, 200, 10);   // 座標(100,200)に 10を設定
Definition at line 75 of file graph.h.
Referenced by wSetPixel().
Function Documentation
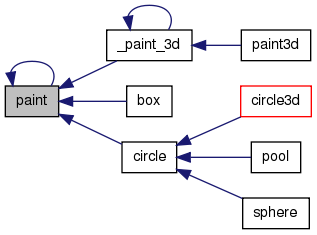
| void _paint_3d | ( | WSGraph | vp, | |
| int | x, | |||
| int | y, | |||
| int | z, | |||
| int | mn, | |||
| int | mx, | |||
| int | c, | |||
| int | m | |||
| ) |
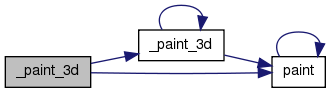
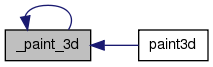
void _paint_3d(WSGraph vp, int x, int y, int z, int mn, int mx, int c, int m)
paint3d() の補助関数
Definition at line 361 of file graph.c.
References _paint_3d(), DEBUG_MODE, WSGraph::gp, paint(), WSGraph::state, WSGraph::xs, WSGraph::ys, and WSGraph::zs.
Referenced by _paint_3d(), and paint3d().
00362 {
00363     int  i, j, ps, cc;
00364     WSGraph xp;
00365
00366     ps  = vp.xs*vp.ys;
00367     xp.xs = vp.xs;
00368     xp.ys = vp.ys;
00369     xp.zs = 1;
00370     xp.gp = &(vp.gp[z*ps]);
00371     xp.state = vp.state;
00372
00373     cc = xp.gp[y*xp.xs+x];
00374     if (cc>mx || cc<mn) return;
00375     paint(xp, x, y, mn, mx, c, m);
00376     if (m<0) {
00377         DEBUG_MODE fprintf(stderr,"_paint_3d: zz = %d\n",z);
00378     }
00379
00380     for (i=0; i<ps; i++) {
00381         if (xp.gp[i]==c) {
00382             x = i%vp.xs;
00383             y = i/vp.xs;
00384             if (z-1>=0) {
00385                 j = (z-1)*ps+y*vp.xs+x;
00386                 if (vp.gp[j]<=mx && vp.gp[j]>=mn) _paint_3d(vp, x, y, z-1, mn, mx, c, m);
00387             }
00388             if (z+1<vp.zs) {
00389                 j = (z+1)*ps+y*vp.xs+x;
00390                 if (vp.gp[j]<=mx && vp.gp[j]>=mn) _paint_3d(vp, x, y, z+1, mn, mx, c, m);
00391             }
00392         }
00393     }
00394
00395     return;
00396 }
| void bline | ( | BSGraph | vp, | |
| int | x1, | |||
| int | y1, | |||
| int | x2, | |||
| int | y2, | |||
| int | cc | |||
| ) |
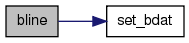
void bline(BSGraph vp, int x1, int y1, int x2, int y2, int cc)
2Dのラインの描画.
点(x1,y1)から点(x2,y2)へ濃度 ccの線を引く.
- Parameters:
-
vp 操作対象となるグラフィックデータ構造体. x1,y1 線の始点の座標. x2,y2 線の終点の座標. cc 線の濃度.
- 使用例
line(vp, 100, 200, 300, 300, 200); // (100,200)から(300,300)へ濃度 200の線を引く
Definition at line 416 of file graph.c.
References set_bdat().
00417 {
00418     int  thresh=0, index;
00419     int  xunit=1;
00420     int  yunit=1;
00421     int  xdiff=x2-x1;
00422     int  ydiff=y2-y1;
00423
00424     if (xdiff<0) {
00425         xdiff = -xdiff;
00426         xunit = -1;
00427     }
00428     if (ydiff<0) {
00429         ydiff = -ydiff;
00430         yunit = -1;
00431     }
00432
00433     if (xdiff>ydiff) {
00434         for (index=0; index<xdiff+1; index++) {
00435             set_bdat(vp, x1, y1, 0, cc);
00436             x1 = x1 + xunit;
00437             thresh = thresh + ydiff;
00438             if (thresh>=xdiff) {
00439                 thresh = thresh - xdiff;
00440                 y1 = y1 + yunit;
00441             }
00442         }
00443     }
00444     else {
00445         for (index=0; index<ydiff+1; index++) {
00446             set_bdat(vp, x1, y1, 0, cc);
00447             y1 = y1 + yunit;
00448             thresh = thresh + xdiff;
00449             if (thresh>=ydiff) {
00450                 thresh = thresh - ydiff;
00451                 x1 = x1 + xunit;
00452             }
00453         }
00454     }
00455 }
| void bline3d | ( | BSGraph | gd, | |
| int | x1, | |||
| int | y1, | |||
| int | z1, | |||
| int | x2, | |||
| int | y2, | |||
| int | z2, | |||
| int | cc | |||
| ) |
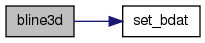
void bline3d(BSGraph gd, int x1, int y1, int z1, int x2, int y2, int z2, int cc)
3Dのラインの描画.点(x1,y1,z1)から点(x2,y2,z2)へ濃度 ccの線を引く.
- Parameters:
-
gd 操作対象となるグラフィックデータ構造体. x1,y1,z1 線の始点の座標. x2,y2,z2 線の終点の座標. cc 線の濃度.
Definition at line 630 of file graph.c.
References set_bdat().
Referenced by draw_shape_polygon().
00631 {
00632     int  i;
00633     int  xx, yy, zz, dx, dy, dz;
00634     int  ux=1, uy=1, uz=1;
00635     int  sx=0, sy=0, sz=0;
00636
00637     dx = x2 - x1;
00638     dy = y2 - y1;
00639     dz = z2 - z1;
00640
00641     if (dx<0) {
00642         dx = -dx;
00643         ux = -1;
00644     }
00645     if (dy<0) {
00646         dy = -dy;
00647         uy = -1;
00648     }
00649     if (dz<0) {
00650         dz = -dz;
00651         uz = -1;
00652     }
00653
00654     xx = x1;
00655     yy = y1;
00656     zz = z1;
00657
00658     set_bdat(gd, xx, yy, zz, cc);
00659     if (dx>=dy && dx>=dz) {
00660         for (i=1; i<=dx; i++) {
00661             xx = xx + ux;
00662             sy = sy + dy;
00663             sz = sz + dz;
00664             if (sy>dx) {
00665                 sy = sy - dx;
00666                 yy = yy + uy;
00667             }
00668             if (sz>dx) {
00669                 sz = sz - dx;
00670                 zz = zz + uz;
00671             }
00672             set_bdat(gd, xx, yy, zz, cc);
00673         }
00674     }
00675     else if (dy>dx && dy>=dz) {
00676         for (i=1; i<=dy; i++) {
00677             yy = yy + uy;
00678             sx = sx + dx;
00679             sz = sz + dz;
00680             if (sx>dy) {
00681                 sx = sx - dy;
00682                 xx = xx + ux;
00683             }
00684             if (sz>dy) {
00685                 sz = sz - dy;
00686                 zz = zz + uz;
00687             }
00688             set_bdat(gd, xx, yy, zz, cc);
00689         }
00690     }
00691     else {
00692         for (i=1; i<=dz; i++) {
00693             zz = zz + uz;
00694             sx = sx + dx;
00695             sy = sy + dy;
00696             if (sx>dz) {
00697                 sx = sx - dz;
00698                 xx = xx + ux;
00699             }
00700             if (sy>dz) {
00701                 sy = sy - dz;
00702                 yy = yy + uy;
00703             }
00704             set_bdat(gd, xx, yy, zz, cc);
00705         }
00706     }
00707 }

| void box | ( | WSGraph | vp, | |
| int | x1, | |||
| int | y1, | |||
| int | x2, | |||
| int | y2, | |||
| int | cc, | |||
| int | mode | |||
| ) |
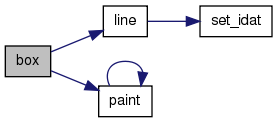
void box(WSGraph vp, int x1, int y1, int x2, int y2, int cc, int mode)
点(x1,y1)-(x2,y2)を対角とした四角形を描く.線の濃度は cc.
modeが 1以上なら,四角形の内部を塗りつぶす.
- Parameters:
-
vp 操作対象となるグラフィックデータ構造体. (x1,y1)-(x2,y2) 四角形の対角の座標. cc 線の濃度. mode ON なら四角形の内部の0〜ccをccで塗りつぶす.
- 使用例
box(vp, 100, 100, 200, 200, 1000, 0); // (100,100),(200,200)を対角とした四角形を描く
Definition at line 605 of file graph.c.
References line(), ON, and paint().
00606 {
00607     line(vp, x1, y1, x2, y1, cc);
00608     line(vp, x2, y1, x2, y2, cc);
00609     line(vp, x2, y2, x1, y2, cc);
00610     line(vp, x1, y2, x1, y1, cc);
00611
00612     if (mode==ON) {
00613         paint(vp, (x1+x2)/2, (y1+y2)/2, 0, cc-1, cc, 4);
00614     }
00615     return;
00616 }
| void circle | ( | WSGraph | gd, | |
| int | x, | |||
| int | y, | |||
| int | r, | |||
| int | cc, | |||
| int | mode | |||
| ) |
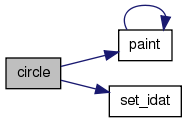
void circle(WSGraph gd, int x, int y, int r, int cc, int mode)
2Dの円の描画.点(x,y)を中心に半径rで濃度 ccの円を書く.
- Parameters:
-
gd 操作対象となるグラフィックデータ構造体. x,y 円の中心の座標. r 円の半径. cc 線の濃度. mode ON なら円の内部の 0〜ccを ccで塗りつぶす.
Definition at line 813 of file graph.c.
References WSGraph::gp, ON, paint(), set_idat(), and WSGraph::xs.
Referenced by circle3d(), pool(), and sphere().
00814 {
00815     double yy, dy, dt;
00816     int i, nn, cx;
00817     int ix, iy, ux=1;
00818     int *px, *py;
00819
00820     if (r<=0) return;
00821
00822     px = (int*)malloc(sizeof(int)*(r+1));
00823     py = (int*)malloc(sizeof(int)*(r+1));
00824     if (px==NULL || py==NULL) {
00825         free(px);
00826         free(py);
00827         return;
00828     }
00829
00830     ix = 0;
00831     iy = r;
00832     yy = (double)r;
00833     nn = 0;
00834     px[0] = ix;
00835     py[0] = iy;
00836
00837     cx = (y+iy)*gd.xs + (x+ix);
00838     gd.gp[cx] = cc;
00839     while(iy>=ix) {
00840         ix = ix + ux;
00841         dt = -ux/yy;
00842         dy = ix*dt;
00843         yy = yy + dy;
00844         iy = (int)yy;
00845
00846         set_idat(gd, x+ix, y+iy, 0, cc);
00847         nn++;
00848         px[nn] = ix;
00849         py[nn] = iy;
00850     }
00851
00852     for (i=0; i<=nn; i++) {
00853         ix = py[nn-i];
00854         iy = px[nn-i];
00855         set_idat(gd, x+ix, y+iy, 0, cc);
00856     }
00857
00858     for (i=0; i<=nn; i++) {
00859         ix = py[i];
00860         iy = -px[i];
00861         set_idat(gd, x+ix, y+iy, 0, cc);
00862     }
00863
00864     for (i=0; i<=nn; i++) {
00865         ix = px[nn-i];
00866         iy = -py[nn-i];
00867         set_idat(gd, x+ix, y+iy, 0, cc);
00868     }
00869
00870     for (i=0; i<=nn; i++) {
00871         ix = -px[i];
00872         iy = -py[i];
00873         set_idat(gd, x+ix, y+iy, 0, cc);
00874     }
00875
00876     for (i=0; i<=nn; i++) {
00877         ix = -py[nn-i];
00878         iy = -px[nn-i];
00879         set_idat(gd, x+ix, y+iy, 0, cc);
00880     }
00881
00882     for (i=0; i<=nn; i++) {
00883         ix = -py[i];
00884         iy = px[i];
00885         set_idat(gd, x+ix, y+iy, 0, cc);
00886     }
00887
00888     for (i=0; i<=nn; i++) {
00889         ix = -px[nn-i];
00890         iy = py[nn-i];
00891         set_idat(gd, x+ix, y+iy, 0, cc);
00892     }
00893
00894     if (mode==ON) paint(gd, x, y, 0, cc-1, cc, 4);
00895
00896     free(px);
00897     free(py);
00898 }
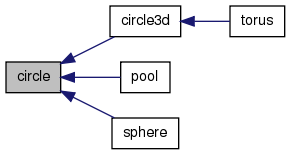
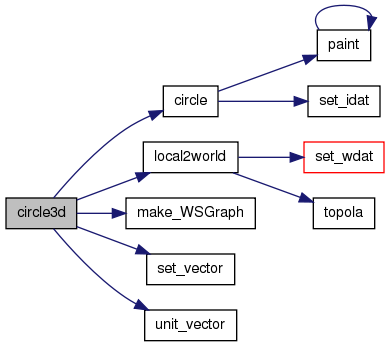
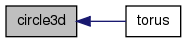
void circle3d(WSGraph vp, vector ox, vector ex, int rr, int cc, int mode)
3D的な円の描画.
- Parameters:
-
gd 操作対象となるグラフィックデータ構造体. ox 円の中心の座標ベクトル. ex 円の中心の法線ベクトル. rr 円の半径. cc 線の濃度. mode ON なら円の内部の 0〜ccを ccで塗りつぶす.
Definition at line 914 of file graph.c.
References circle(), WSGraph::gp, local2world(), make_WSGraph(), set_vector(), unit_vector(), WSGraph::xs, and WSGraph::ys.
Referenced by torus().
00915 {
00916     vector   oz;
00917     WSGraph  vp;
00918
00919     vp = make_WSGraph(2*rr+3, 2*rr+3, 1);
00920     if (vp.gp==NULL) return;
00921     circle(vp, rr+1, rr+1, rr, cc, mode);
00922
00923     oz = set_vector((vp.xs-1)/2., (vp.ys-1)/2., 0.0);
00924     ex = unit_vector(ex);
00925     local2world(gd, vp, ox, oz, ex, NULL, NULL);
00926
00927     free(vp.gp);
00928 }
void copy_WSGraph(WSGraph src, WSGraph dst)
WSGraph型データのバッファ部をコピーする.とにかくコピーする.できるだけコピーする.
コピー元とコピー先のバッファ部のサイズが合わない場合,コピー結果は保証されない.
- Parameters:
-
src コピー元グラフィックデータ dst コピー先グラフィックデータ
Definition at line 1380 of file graph.c.
References WSGraph::gp, Min, WSGraph::xs, WSGraph::ys, and WSGraph::zs.
01381 {
01382     int  i, ssz, dsz, sz;
01383
01384     if (src.zs<=0) src.zs = 1;
01385     if (dst.zs<=0) dst.zs = 1;
01386     ssz = src.xs*src.ys*src.zs;
01387     dsz = dst.xs*dst.ys*dst.zs;
01388     sz  = Min(ssz, dsz);
01389
01390     for (i=0;  i<sz;  i++) dst.gp[i] = src.gp[i];
01391     for (i=sz; i<dsz; i++) dst.gp[i] = 0;
01392     return;
01393 }
WSGraph cut_object(WSGraph vp, int cc, IRBound* rb, int blank)
グラフィックデータから cc以上の輝度値を持つ部分を抜き出す.
- Parameters:
-
vp 操作対象となるグラフィックデータ構造体. cc 抜き出す画像の輝度値.これ以上御輝度値部分を抜き出す. [out] rb 指定しない.抜き出された画像の境界情報が入る. blank 余白
- Returns:
- 抜き出されたグラフィックデータ.
Definition at line 1174 of file graph.c.
References WSGraph::gp, init_IRBound(), JBXL_GRAPH_MEMORY_ERROR, make_WSGraph(), Max, Min, WSGraph::state, IRBound::xmax, IRBound::xmin, WSGraph::xs, IRBound::ymax, IRBound::ymin, WSGraph::ys, IRBound::zmax, IRBound::zmin, and WSGraph::zs.
01175 {
01176     int  i, j, k, cx, ax;
01177     WSGraph xp;
01178
01179     init_IRBound(rb);
01180
01181     for (i=0; i<vp.xs; i++)
01182     for (j=0; j<vp.ys; j++)
01183     for (k=0; k<vp.zs; k++) {
01184         cx = vp.xs*vp.ys*k + vp.xs*j + i;
01185         if (vp.gp[cx]>=cc) {
01186             rb->xmax = Max(rb->xmax, i);
01187             rb->ymax = Max(rb->ymax, j);
01188             rb->zmax = Max(rb->zmax, k);
01189             rb->xmin = Min(rb->xmin, i);
01190             rb->ymin = Min(rb->ymin, j);
01191             rb->zmin = Min(rb->zmin, k);
01192         }
01193     }
01194
01195     if (blank!=0) {
01196         rb->xmax += blank;
01197         rb->ymax += blank;
01198         rb->zmax += blank;
01199         rb->xmin -= blank;
01200         rb->ymin -= blank;
01201         rb->zmin -= blank;
01202         rb->xmin = Max(rb->xmin, 0);
01203         rb->ymin = Max(rb->ymin, 0);
01204         rb->zmin = Max(rb->zmin, 0);
01205         rb->zmax = Min(rb->zmax, vp.zs-1);
01206     }
01207
01208     xp.xs = rb->xmax - rb->xmin + 1;
01209     xp.ys = rb->ymax - rb->ymin + 1;
01210     xp.zs = rb->zmax - rb->zmin + 1;
01211     xp = make_WSGraph(xp.xs, xp.ys, xp.zs);
01212     if (xp.gp==NULL) {
01213         xp.state = JBXL_GRAPH_MEMORY_ERROR;
01214         return xp;
01215     }
01216
01217     for (i=0; i<xp.xs; i++) {
01218         for (j=0; j<xp.ys; j++) {
01219             for (k=0; k<xp.zs; k++) {
01220                 cx = xp.xs*xp.ys*k + xp.xs*j + i;
01221                 ax = vp.xs*vp.ys*(k+rb->zmin) + vp.xs*(j+rb->ymin) + (i+rb->xmin);
01222                 if (vp.gp[ax]>=cc) xp.gp[cx] = vp.gp[ax];
01223             }
01224         }
01225     }
01226
01227     return xp;
01228 }
| int get_bdat | ( | BSGraph | gd, | |
| int | xx, | |||
| int | yy, | |||
| int | zz | |||
| ) |
int get_bdat(BSGraph gd, int xx, int yy, int zz)
グラフィックデータ構造体 vpの任意の 1voxelの値(濃度)を返す.
座標の範囲チェックあり.Z軸の歪補整はなし.
- Parameters:
-
gd 操作対象となるグラフィックデータ構造体. xx,yy,zz 値を設定する xyz座標.
- Returns:
- (xx,yy,zz)点の濃度(輝度値).(xx,yy,zz)が座標の範囲外の場合は0を返す.
Definition at line 79 of file graph.c.
References BSGraph::gp, BSGraph::xs, BSGraph::ys, and BSGraph::zs.
| int get_idat | ( | WSGraph | gd, | |
| int | xx, | |||
| int | yy, | |||
| int | zz | |||
| ) |
int get_idat(WSGraph gd, int xx, int yy, int zz)
グラフィックデータ構造体 vpの任意の 1voxelの値(濃度)を返す.
座標の範囲チェックあり.Z軸の歪補整はなし.
- Parameters:
-
gd 操作対象となるグラフィックデータ構造体. xx,yy,zz 値を設定する xyz座標.
- Returns:
- (xx,yy,zz)点の濃度(輝度値).(xx,yy,zz)が座標の範囲外の場合は0を返す.
Definition at line 25 of file graph.c.
References WSGraph::gp, WSGraph::xs, WSGraph::ys, and WSGraph::zs.
int get_wdat(WSGraph gd, double xx, double yy, double zz, IRBound rb)
グラフィックデータ構造体 vpの任意の 1voxelの値(濃度)を返す.
座標の範囲チェックあり.Z軸の歪補整あり(RZxy).
- Parameters:
-
gd 操作対象となるグラフィックデータ構造体. xx,yy,zz 値を設定する xyz座標. rb 境界の底上げ値.rb.?min を基底値にする.
- Returns:
- (xx,yy,zz)点の濃度(輝度値).(xx,yy,zz)が座標の範囲外の場合は0を返す.
Definition at line 49 of file graph.c.
References chk_RZxy(), WSGraph::gp, RZxy, IRBound::xmin, WSGraph::xs, IRBound::ymin, WSGraph::ys, IRBound::zmin, and WSGraph::zs.
00050 {
00051     int  ix, iy, iz;
00052     int  ret = 0;
00053
00054     if (chk_RZxy()) zz = zz*RZxy;  // (ex.  *0.4/2.0)
00055
00056     ix = (int)(xx+0.5) - rb.xmin;
00057     iy = (int)(yy+0.5) - rb.ymin;
00058     iz = (int)(zz+0.5) - rb.zmin;
00059
00060     if (ix>=0&&ix<gd.xs&&iy>=0&&iy<gd.ys&&iz>=0&&iz<gd.zs){
00061         ret = gd.gp[iz*gd.xs*gd.ys + iy*gd.xs + ix];
00062     }
00063     return ret;
00064 }
WSGraph grab_WSGraph(WSGraph vp, int x1, int y1, int x2, int y2)
WSGraph型データの (x1,y1)-(x2,y2)の矩形部分だけを取り出す.
(x1,y1)-(x2,y2)が元のデータのサイズを越える場合は,元のデータに合わせられる.
- Parameters:
-
vp 操作対象グラフィックデータ (x1,y1),(x2,y2) 矩形の対角の座標.
- Returns:
- 取り出したグラフィックデータ.
Definition at line 1338 of file graph.c.
References WSGraph::gp, JBXL_GRAPH_MEMORY_ERROR, make_WSGraph(), Max, Min, Px, WSGraph::state, WSGraph::xs, and WSGraph::ys.
01339 {
01340     int  i, j, xs, xe, ys, ye, xsize, ysize;
01341     WSGraph xp;
01342
01343     xs = Min(x1, x2);
01344     xe = Max(x1, x2);
01345     xe = Min(xe, vp.xs-1);
01346     ys = Min(y1, y2);
01347     ye = Max(y1, y2);
01348     ye = Min(ye, vp.ys-1);
01349     xsize = xe - xs + 1;
01350     ysize = ye - ys + 1;
01351
01352     xp = make_WSGraph(xsize, ysize, 1);
01353     if (xp.gp==NULL) {
01354         memset(&xp, 0, sizeof(WSGraph));
01355         xp.state = JBXL_GRAPH_MEMORY_ERROR;
01356         return xp;
01357     }
01358
01359     for (j=0; j<ysize; j++) {
01360         for (i=0; i<xsize; i++) {
01361             Px(xp, i, j) = Px(vp, i+xs, j+ys);
01362         }
01363     }
01364
01365     return xp;
01366 }
| int isinctri | ( | int | x1, | |
| int | y1, | |||
| int | x2, | |||
| int | y2, | |||
| int | x3, | |||
| int | y3, | |||
| int | xx, | |||
| int | yy | |||
| ) |
int isinctri(int x1, int y1, int x2, int y2, int x3, int y3, int xx, int yy)
点(xx, yy) が三角形の中に含まれているか判定する
- Return values:
-
TRUE (xx,yy) は三角形 (x1,y1)-(x2,y2)-(x3,y3)の内部にある. FALSE (xx,yy) は三角形 (x1,y1)-(x2,y2)-(x3,y3)の内部にない.
Definition at line 574 of file graph.c.
References FALSE, isCrossLine, and TRUE.
Referenced by triangle().
00575 {
00576     int cx, cy;
00577
00578     cx = (x1 + x2 + x3)/3;
00579     cy = (y1 + y2 + y3)/3;
00580
00581     if (isCrossLine(x1, y1, x2, y2, xx, yy, cx, cy)<0) return FALSE;
00582     if (isCrossLine(x1, y1, x3, y3, xx, yy, cx, cy)<0) return FALSE;
00583     if (isCrossLine(x2, y2, x3, y3, xx, yy, cx, cy)<0) return FALSE;
00584     return TRUE;
00585 }
| void line | ( | WSGraph | vp, | |
| int | x1, | |||
| int | y1, | |||
| int | x2, | |||
| int | y2, | |||
| int | cc | |||
| ) |
void line(WSGraph vp, int x1, int y1, int x2, int y2, int cc)
2Dのラインの描画.
点(x1,y1)から点(x2,y2)へ濃度 ccの線を引く.
- Parameters:
-
vp 操作対象となるグラフィックデータ構造体. x1,y1 線の始点の座標. x2,y2 線の終点の座標. cc 線の濃度.
- 使用例
line(vp, 100, 200, 300, 300, 200); // (100,200)から(300,300)へ濃度 200の線を引く
Definition at line 475 of file graph.c.
References set_idat().
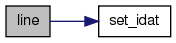
Referenced by box(), bvh_get_seq_data(), count_lines(), get_tList_line_Buffer(), get_tList_seq_data_Buffer(), triangle(), and wLine().
00476 {
00477     int  thresh=0, index;
00478     int  xunit=1;
00479     int  yunit=1;
00480     int  xdiff=x2-x1;
00481     int  ydiff=y2-y1;
00482
00483     if (xdiff<0) {
00484         xdiff = -xdiff;
00485         xunit = -1;
00486     }
00487     if (ydiff<0) {
00488         ydiff = -ydiff;
00489         yunit = -1;
00490     }
00491
00492     if (xdiff>ydiff) {
00493         for (index=0; index<xdiff+1; index++) {
00494             set_idat(vp, x1, y1, 0, cc);
00495             x1 = x1 + xunit;
00496             thresh = thresh + ydiff;
00497             if (thresh>=xdiff) {
00498                 thresh = thresh - xdiff;
00499                 y1 = y1 + yunit;
00500             }
00501         }
00502     }
00503     else {
00504         for (index=0; index<ydiff+1; index++) {
00505             set_idat(vp, x1, y1, 0, cc);
00506             y1 = y1 + yunit;
00507             thresh = thresh + xdiff;
00508             if (thresh>=ydiff) {
00509                 thresh = thresh - ydiff;
00510                 x1 = x1 + xunit;
00511             }
00512         }
00513     }
00514 }
| void line3d | ( | WSGraph | gd, | |
| int | x1, | |||
| int | y1, | |||
| int | z1, | |||
| int | x2, | |||
| int | y2, | |||
| int | z2, | |||
| int | cc | |||
| ) |
void line3d(WSGraph gd, int x1, int y1, int z1, int x2, int y2, int z2, int cc)
3Dのラインの描画.点(x1,y1,z1)から点(x2,y2,z2)へ濃度 ccの線を引く.
- Parameters:
-
gd 操作対象となるグラフィックデータ構造体. x1,y1,z1 線の始点の座標. x2,y2,z2 線の終点の座標. cc 線の濃度.
Definition at line 721 of file graph.c.
References set_idat().
00722 {
00723     int  i;
00724     int  xx, yy, zz, dx, dy, dz;
00725     int  ux=1, uy=1, uz=1;
00726     int  sx=0, sy=0, sz=0;
00727
00728     dx = x2 - x1;
00729     dy = y2 - y1;
00730     dz = z2 - z1;
00731
00732     if (dx<0) {
00733         dx = -dx;
00734         ux = -1;
00735     }
00736     if (dy<0) {
00737         dy = -dy;
00738         uy = -1;
00739     }
00740     if (dz<0) {
00741         dz = -dz;
00742         uz = -1;
00743     }
00744
00745     xx = x1;
00746     yy = y1;
00747     zz = z1;
00748
00749     set_idat(gd, xx, yy, zz, cc);
00750     if (dx>=dy && dx>=dz) {
00751         for (i=1; i<=dx; i++) {
00752             xx = xx + ux;
00753             sy = sy + dy;
00754             sz = sz + dz;
00755             if (sy>dx) {
00756                 sy = sy - dx;
00757                 yy = yy + uy;
00758             }
00759             if (sz>dx) {
00760                 sz = sz - dx;
00761                 zz = zz + uz;
00762             }
00763             set_idat(gd, xx, yy, zz, cc);
00764         }
00765     }
00766     else if (dy>dx && dy>=dz) {
00767         for (i=1; i<=dy; i++) {
00768             yy = yy + uy;
00769             sx = sx + dx;
00770             sz = sz + dz;
00771             if (sx>dy) {
00772                 sx = sx - dy;
00773                 xx = xx + ux;
00774             }
00775             if (sz>dy) {
00776                 sz = sz - dy;
00777                 zz = zz + uz;
00778             }
00779             set_idat(gd, xx, yy, zz, cc);
00780         }
00781     }
00782     else {
00783         for (i=1; i<=dz; i++) {
00784             zz = zz + uz;
00785             sx = sx + dx;
00786             sy = sy + dy;
00787             if (sx>dz) {
00788                 sx = sx - dz;
00789                 xx = xx + ux;
00790             }
00791             if (sy>dz) {
00792                 sy = sy - dz;
00793                 yy = yy + uy;
00794             }
00795             set_idat(gd, xx, yy, zz, cc);
00796         }
00797     }
00798 }
| void local2world | ( | WSGraph | gd, | |
| WSGraph | vp, | |||
| vector | ox, | |||
| vector | oz, | |||
| vector | ex, | |||
| double * | pcsf, | |||
| double * | psnf | |||
| ) |
void local2world(WSGraph gd, WSGraph vp, vector ox, vector oz, vector ex, double* pcsf, double* psnf)
ロカール座標系のグラフィック vpをグローバル座標系のグラフィック gdに埋めこむ.
- Parameters:
-
gd グローバル座標系のグラフィックデータ構造体. vp ローカル座標系のグラフィックデータ構造体. ox gdvpの原点の座標. oz gdから見た vpの原点の座標. ex gdから見た vpの座標の向き. [in,out] pcsf 通常は cosφの値が入る. sinθが0に近い場合は計算しないので,連続計算の場合は予め直前の cosφの値を入れて置く. [in,out] psnf 通常は sinφの値が入る. sinθが0に近い場合は計算しないので,連続計算の場合は予め直前の sinφの値を入れて置く.
Definition at line 197 of file graph.c.
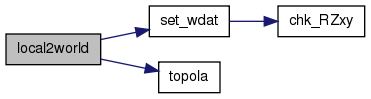
References WSGraph::gp, IRBound::misc, ON, set_wdat(), topola(), vector::x, IRBound::xmin, WSGraph::xs, vector::y, IRBound::ymin, WSGraph::ys, vector::z, IRBound::zmin, and WSGraph::zs.
Referenced by circle3d(), pool(), and torus().
00198 {
00199     int  x, y, z, cx, cy, cz;
00200     double px, py, pz, xx, yy, zz;
00201     double cst, snt, csf=0.0, snf=1.0;
00202     IRBound rb;
00203
00204     if (pcsf!=NULL && psnf!=NULL) {
00205         csf = *pcsf;
00206         snf = *psnf;
00207     }
00208
00209     rb.xmin = rb.ymin = rb.zmin = 0;
00210     rb.misc = ON;
00211     topola(ex, &cst, &snt, &csf, &snf);
00212
00213     for(z=0; z<vp.zs; z++) {
00214         cz = z*vp.xs*vp.ys;
00215         for(y=0; y<vp.ys; y++) {
00216             cy = cz + y*vp.xs;
00217             for(x=0; x<vp.xs; x++) {
00218                 cx = cy + x;
00219                 if(vp.gp[cx]!=0) {
00220                     px = z - oz.z;
00221                     py = oz.x - x;
00222                     pz = oz.y - y;
00223                     xx = px*snt*csf - py*snf - pz*cst*csf + ox.x;
00224                     yy = px*snt*snf + py*csf - pz*cst*snf + ox.y;
00225                     zz = px*cst              + pz*snt     + ox.z;
00226                     set_wdat(gd, xx, yy, zz, vp.gp[cx], rb);
00227                 }
00228             }
00229         }
00230     }
00231
00232     if (pcsf!=NULL && psnf!=NULL) {
00233         *pcsf = csf;
00234         *psnf = snf;
00235     }
00236 }
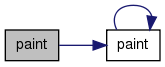
| void paint | ( | WSGraph | vp, | |
| int | x, | |||
| int | y, | |||
| int | mn, | |||
| int | mx, | |||
| int | c, | |||
| int | m | |||
| ) |
void paint(WSGraph vp, int x, int y, int mn, int mx, int c, int m)
2Dグラフィックの塗りつぶし.
2Dグラフィック vpの点(x,y)から始めて, mn〜mx の輝度値を c で塗りつぶす.
- Parameters:
-
vp グラフィックデータ構造体. x 塗りつぶしを始める点の x座標. y 塗りつぶしを始める点の y座標. mn 塗りつぶされる輝度値の最小値 mx 塗りつぶされる輝度値の最大値. c 塗りつぶしの輝度値. m モード
8: 8近傍の塗りつぶし
その他: 4近傍の塗りつぶし
Definition at line 256 of file graph.c.
References WSGraph::gp, paint(), Xabs, WSGraph::xs, and WSGraph::ys.
Referenced by _paint_3d(), box(), circle(), and paint().
00257 {
00258     int  i, j, k, cc;
00259
00260     if (c<=mx && c>=mn) {
00261         fprintf(stderr,"PAINT: c = %d. Not be %d< c <%d\n\n",c,mn,mx);
00262         return;
00263     }
00264
00265     cc = vp.gp[y*vp.xs+x];
00266     if (cc>mx || cc<mn) return;
00267
00268     while(x>0) {
00269         if (vp.gp[y*vp.xs+x-1]>mx || vp.gp[y*vp.xs+x-1]<mn) break;
00270         x--;
00271     }
00272     k = x;
00273
00274     while(k<vp.xs) {
00275         if (vp.gp[y*vp.xs+k]>mx || vp.gp[y*vp.xs+k]<mn) break;
00276         vp.gp[y*vp.xs+k] = c;
00277         k++;
00278     }
00279     k--;
00280
00281     for (i=x; i<=k; i++){
00282         if (y-1>=0 && y-1<vp.ys){
00283             j = (y-1)*vp.xs+i;
00284             if (vp.gp[j]<=mx && vp.gp[j]>=mn) {
00285                 paint(vp, i, y-1, mn, mx, c, m);
00286             }
00287
00288             if (Xabs(m)==8) {  // 8-neighborhood *
00289                 if (i-1>=0) {
00290                     if (vp.gp[j-1]<=mx && vp.gp[j-1]>=mn) {
00291                         paint(vp, i-1, y-1, mn, mx, c, m);
00292                     }
00293                 }
00294                 if (i+1<vp.xs) {
00295                     if (vp.gp[j+1]<=mx && vp.gp[j+1]>=mn) {
00296                         paint(vp, i+1, y-1, mn, mx, c, m);
00297                     }
00298                 }
00299             }
00300         }
00301
00302         if (y+1>=0 && y+1<vp.ys){
00303             j = (y+1)*vp.xs+i;
00304             if (vp.gp[j]<=mx && vp.gp[j]>=mn) {
00305                 paint(vp, i, y+1, mn, mx, c, m);
00306             }
00307
00308             if (Xabs(m)==8) {  // 8-neighborhood
00309                 if (i-1>=0) {
00310                     if (vp.gp[j-1]<=mx && vp.gp[j-1]>=mn) {
00311                         paint(vp, i-1, y+1, mn, mx, c, m);
00312                     }
00313                 }
00314                 if (i+1<vp.xs) {
00315                     if (vp.gp[j+1]<=mx && vp.gp[j+1]>=mn) {
00316                         paint(vp, i+1, y+1, mn, mx, c, m);
00317                     }
00318                 }
00319             }
00320         }
00321     }
00322     return;
00323 }
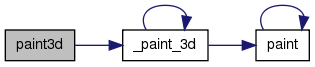
| void paint3d | ( | WSGraph | vp, | |
| int | x, | |||
| int | y, | |||
| int | z, | |||
| int | mn, | |||
| int | mx, | |||
| int | c, | |||
| int | m | |||
| ) |
void paint3d(WSGraph vp, int x, int y, int z, int mn, int mx, int c, int m)
3Dグラフィックの塗りつぶし.
3Dグラフィック vpの点(x,y,z)から始めて, mn〜mx の輝度値を c で塗りつぶす.
- Parameters:
-
vp グラフィックデータ構造体. x,y,z 塗りつぶしを始める点の座標. mn 塗りつぶされる輝度値の最小値 mx 塗りつぶされる輝度値の最大値. c 塗りつぶしの輝度値. m モード.マイナスの場合は途中経過を表示.
+-8: 8近傍の塗りつぶし
その他: 4近傍の塗りつぶし
注:プログラム中で EGMAX を使用.
Definition at line 344 of file graph.c.
References _paint_3d(), WSGraph::gp, SWORDMAX, WSGraph::xs, WSGraph::ys, and WSGraph::zs.
00345 {
00346     int  i;
00347
00348     _paint_3d(vp, x, y, z, mn, mx, SWORDMAX, m);
00349     for (i=0; i<vp.xs*vp.ys*vp.zs; i++) {
00350         if (vp.gp[i]==SWORDMAX) vp.gp[i] = c;
00351     }
00352 }
void pool(WSGraph gd, vector a, vector b, int rr, int cc)
3D的な円柱の描画.中身はccで塗りつぶされる.
- Parameters:
-
gd 操作対象となるグラフィックデータ構造体. a 円柱の一方の底面の円の中心の座標ベクトル. b 円柱のもう一方の底面の円の中心の座標ベクトル. rr 円柱の半径. cc 線と塗りつぶしの濃度.
Definition at line 943 of file graph.c.
References circle(), WSGraph::gp, local2world(), make_WSGraph(), vector::n, ON, set_vector(), sub_vector, unit_vector(), WSGraph::xs, WSGraph::ys, and WSGraph::zs.
00944 {
00945     int  i, ll, cz;
00946     vector  ox, oz, ev;
00947     WSGraph vp, px;
00948
00949     ox = sub_vector(b, a);
00950     ll = (int)(ox.n + 0.5);
00951     vp = px = make_WSGraph(2*rr+3, 2*rr+3, ll);
00952     if (vp.gp==NULL) return;
00953
00954     for (i=0; i<vp.zs; i++) {
00955         cz = i*vp.xs*vp.ys;
00956         px.gp = &(vp.gp[cz]);
00957         circle(px, rr+1, rr+1, rr, cc, ON);
00958     }
00959
00960     oz = set_vector((vp.xs-1)/2., (vp.ys-1)/2., 0.);
00961     ev = unit_vector(ox);
00962     local2world(gd, vp, a, oz, ev, NULL, NULL);
00963     free(vp.gp);
00964
00965     return;
00966 }
| void set_around | ( | WSGraph | vp, | |
| int | cc | |||
| ) |
void set_around(WSGraph vp, int cc)
2Dグラフィックデータの縁の部分の輝度値を ccにする.
- Parameters:
-
vp 操作対象となるグラフィックデータ構造体. cc データの縁に設定する輝度値.
Definition at line 1240 of file graph.c.
References WSGraph::gp, WSGraph::xs, and WSGraph::ys.
01241 {
01242     int  i, px1, px2;
01243
01244     for (i=0; i<vp.xs; i++){
01245         px1 = i;
01246         px2 = (vp.ys-1)*vp.xs + i;
01247         vp.gp[px1] = cc;
01248         vp.gp[px2] = cc;
01249     }
01250     for (i=1; i<vp.ys-1; i++){
01251         px1 = vp.xs*i;
01252         px2 = vp.xs*(i+1) - 1;
01253         vp.gp[px1] = cc;
01254         vp.gp[px2] = cc;
01255     }
01256 }
| void set_bdat | ( | BSGraph | gd, | |
| int | ix, | |||
| int | iy, | |||
| int | iz, | |||
| int | cc | |||
| ) |
void set_bdat(BSGraph gd, int ix, int iy, int iz, int cc)
グラフィックデータ構造体 gdの任意の 1voxelに値を設定する.
座標の範囲チェックあり.Z軸の歪補整はなし.
- Parameters:
-
gd 操作対象となるグラフィックデータ構造体. ix,iy,iz 値を設定する xyz座標. cc 点(ix,iy,iz)に設定する点の値(濃度).
Definition at line 173 of file graph.c.
References BSGraph::gp, BSGraph::xs, BSGraph::ys, and BSGraph::zs.
Referenced by bline(), and bline3d().
00174 {
00175     if (ix>=0&&ix<gd.xs&&iy>=0&&iy<gd.ys&&iz>=0&&iz<gd.zs){
00176         gd.gp[iz*gd.xs*gd.ys + iy*gd.xs + ix] = cc;
00177     }
00178 }
| void set_idat | ( | WSGraph | gd, | |
| int | ix, | |||
| int | iy, | |||
| int | iz, | |||
| int | cc | |||
| ) |
void set_idat(WSGraph gd, int ix, int iy, int iz, int cc)
グラフィックデータ構造体 gdの任意の 1voxelに値を設定する.@ 座標の範囲チェックあり.Z軸の歪補整はなし.
- Parameters:
-
gd 操作対象となるグラフィックデータ構造体. ix,iy,iz 値を設定する xyz座標. cc 点(ix,iy,iz)に設定する点の値(濃度).
Definition at line 101 of file graph.c.
References WSGraph::gp, WSGraph::xs, WSGraph::ys, and WSGraph::zs.
Referenced by circle(), line(), and line3d().
00102 {
00103     if (ix>=0&&ix<gd.xs&&iy>=0&&iy<gd.ys&&iz>=0&&iz<gd.zs){
00104         gd.gp[iz*gd.xs*gd.ys + iy*gd.xs + ix] = cc;
00105     }
00106 }
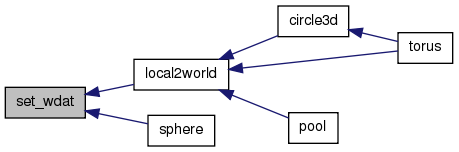
void set_wdat(WSGraph gd, double xx, double yy, double zz, int cc, IRBound rb)
グラフィックデータ構造体 gdの任意の 1voxelに値を設定する.
座標の範囲チェックあり.Z軸の歪補整あり(RZxy).
- Parameters:
-
gd 操作対象となるグラフィックデータ構造体. xx,yy,zz 値を設定する xyz座標. cc 点(xx,yy,zz)に設定する点の値(濃度). rb 境界の底上げ値.rb.?min を基底値にする.
rb.miscが OFの場合,(xx,yy,zz)に一番近い点に ccを設定する.
rb.miscが ONの場合,(xx,yy,zz)の周りの 格子点全てに ccを設定する.
Definition at line 123 of file graph.c.
References chk_RZxy(), WSGraph::gp, IRBound::misc, OFF, RZxy, IRBound::xmin, WSGraph::xs, IRBound::ymin, WSGraph::ys, IRBound::zmin, and WSGraph::zs.
Referenced by local2world(), and sphere().
00124 {
00125     int  i, j, k;
00126     int  x, y, z;
00127     int  ix, iy, iz;
00128
00129     if (chk_RZxy()) zz = zz*RZxy;  // (ex.  *0.4/2.0)
00130
00131     if (rb.misc==OFF) {
00132         ix = (int)(xx+0.5) - rb.xmin;
00133         iy = (int)(yy+0.5) - rb.ymin;
00134         iz = (int)(zz+0.5) - rb.zmin;
00135
00136         if (ix>=0&&ix<gd.xs&&iy>=0&&iy<gd.ys&&iz>=0&&iz<gd.zs){
00137             gd.gp[iz*gd.xs*gd.ys + iy*gd.xs + ix] = cc;
00138         }
00139     }
00140     else {
00141         x = (int)(xx) - rb.xmin;
00142         y = (int)(yy) - rb.ymin;
00143         z = (int)(zz) - rb.zmin;
00144
00145         for (i=0; i<=1; i++) {
00146             for (j=0; j<=1; j++) {
00147                 for (k=0; k<=1; k++) {
00148                     ix = i + x;
00149                     iy = j + y;
00150                     iz = k + z;
00151                     if (ix>=0&&ix<gd.xs&&iy>=0&&iy<gd.ys&&iz>=0&&iz<gd.zs){
00152                         gd.gp[iz*gd.xs*gd.ys + iy*gd.xs + ix] = cc;
00153                     }
00154                 }
00155             }
00156         }
00157     }
00158     return;
00159 }
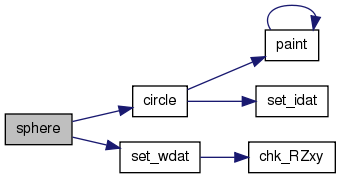
void sphere(WSGraph vp, vector a, int r, int cc, int mode)
球の描画.
- Parameters:
-
vp 操作対象となるグラフィックデータ構造体. a 球の中心の座標ベクトル. r 球の半径. cc 線と塗りつぶしの濃度(mode=1のとき) mode モード.
1: 円を重ねて球を作る.中身はccで塗りつぶされる.
-1: 極座標で球を作る.vpとの境界に壁を作る.
それ以外: 極座標で球を作る.
Definition at line 1029 of file graph.c.
References circle(), WSGraph::gp, IRBound::misc, OFF, ON, PI, RZxy, set_wdat(), vector::x, IRBound::xmin, WSGraph::xs, vector::y, IRBound::ymin, WSGraph::ys, vector::z, IRBound::zmin, and WSGraph::zs.
01030 {
01031     int i, j, k, rx, nn, s = 1;
01032     double th, fi, cs, sn, cf, sf, dt;
01033     double xx, yy, zz, zc;
01034     WSGraph xp;
01035     IRBound rb;
01036
01037     memset(&xp, 0, sizeof(WSGraph));
01038
01039     if (mode==1) {
01040         xp.xs = vp.xs;
01041         xp.ys = vp.ys;
01042         xp.zs = 1;
01043
01044         for (k=(int)(a.z-r+0.5); k<=(int)(a.z+r+0.5); k++) {
01045             if (k>=0 && k<vp.zs) {
01046                 xp.gp = &vp.gp[k*vp.xs*vp.ys];
01047                 rx = (int)(sqrt(r*r-(a.z-k)*(a.z-k))+0.5);
01048                 circle(xp, (int)a.x, (int)a.y, rx, cc, ON);
01049             }
01050         }
01051     }
01052     else {
01053         rb.xmin = rb.ymin = rb.zmin = 0;
01054         rb.misc = OFF;
01055
01056         nn = (int)(2*PI*r + 0.5)*2;
01057         dt = PI/nn;
01058         for (i=0; i<=nn; i++) {
01059             th = dt*i;
01060             sn = sin(th);
01061             cs = cos(th);
01062             zz = r*cs + a.z;
01063             zc = zz*RZxy;
01064             if (mode==-1) {
01065                 if (zc<s)        zz = s/RZxy;
01066                 if (zc>vp.zs-s-1) zz = (vp.zs-s-1)/RZxy;
01067             }
01068             for (j=0; j<=2*nn; j++) {
01069                 fi = dt*j;
01070                 cf = cos(fi);
01071                 sf = sin(fi);
01072                 xx = r*sn*cf + a.x;
01073                 yy = r*sn*sf + a.y;
01074                 if (mode==-1) {
01075                     if (xx<s)         xx = (double)s;
01076                     if (yy<s)         yy = (double)s;
01077                     if (xx>vp.xs-s-1) xx = (double)(vp.xs-s-1);
01078                     if (yy>vp.ys-s-1) yy = (double)(vp.ys-s-1);
01079                 }
01080                 set_wdat(vp, xx, yy, zz, cc, rb);
01081             }
01082         }
01083     }
01084     return;
01085 }
| void topola | ( | vector | nv, | |
| double * | cst, | |||
| double * | snt, | |||
| double * | csf, | |||
| double * | snf | |||
| ) |
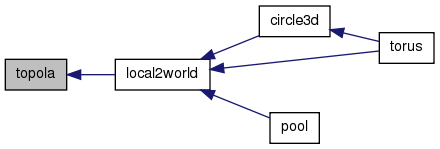
void topola(vector nv, double* cst, double* snt, double* csf, double* snf)
ベクトル nvの単位ベクトルを極座標 (1,θ,φ) へ変換する. ただし,θφは sin, cosの値として返される.
- Parameters:
-
nv 方向ベクトル. [out] cst 指定しない.cosθの値が入る. [out] snt 指定しない.sinθの値が入る. [in,out] csf 通常は cosφの値が入る. sinθが0に近い場合は計算しないので,連続計算の場合は予め直前の cosφの値を入れて置く. [in,out] snf 通常は sinφの値が入る. sinθが0に近い場合は計算しないので,連続計算の場合は予め直前の sinφの値を入れて置く.
Definition at line 1134 of file graph.c.
References EPS, vector::n, Sign, vector::x, vector::y, and vector::z.
Referenced by local2world().
01135 {
01136     if (nv.n>EPS && nv.n!=1.0) {
01137         nv.x = nv.x/nv.n;
01138         nv.y = nv.y/nv.n;
01139         nv.z = nv.z/nv.n;
01140     }
01141
01142     if (nv.z<-1.0) nv.z = -1.0;
01143     if (nv.z> 1.0) nv.z =  1.0;
01144     *cst = nv.z;
01145     *snt = sqrt(1.0-nv.z*nv.z);
01146
01147     if (*snt<EPS) {
01148         *cst = Sign(*cst);
01149         *snt = 0.0;
01150         //*csf = 0.0;
01151         //*snf = 1.0;
01152     }
01153     else {
01154         *csf = nv.x / *snt;
01155         *snf = nv.y / *snt;
01156     }
01157     return;
01158 }
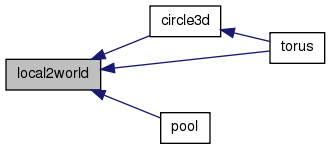
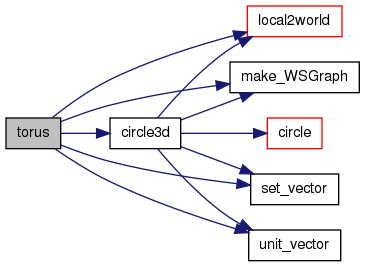
void torus(WSGraph gd, vector ox, vector ex, int rr, int ra, int cc)
3D的なトーラスの描画.中身はccで塗りつぶされる.
- Parameters:
-
gd 操作対象となるグラフィックデータ構造体. ox トーラスの中心の座標ベクトル. ex トーラスの中心の法線ベクトル. rr トーラスの半径(トーラスの中心から断面の円の中心まで). ra トーラスの断面の円の半径 cc 線と塗りつぶしの濃度.
Definition at line 982 of file graph.c.
References circle3d(), WSGraph::gp, local2world(), make_WSGraph(), ON, PI, set_vector(), unit_vector(), WSGraph::xs, WSGraph::ys, and WSGraph::zs.
00983 {
00984     int  i, nn;
00985     double  dt, th, xx, yy, zz, sn, cs;
00986     WSGraph vp;
00987     vector  ve, vo, vz;
00988
00989     vp = make_WSGraph(2*(rr+ra)+3, 2*(rr+ra)+3, 2*ra+3);
00990     if (vp.gp==NULL) return;
00991     nn = (int)(2*PI*(rr+ra)*2);
00992     dt = 2.0*PI/nn;
00993
00994     zz = (vp.zs-1)/2.;
00995     for (i=0; i<nn; i++) {
00996         th = dt*i;
00997         sn = sin(th);
00998         cs = cos(th);
00999         xx = (vp.xs-1)/2. + rr*cs;
01000         yy = (vp.ys-1)/2. - rr*sn;
01001         vo = set_vector(xx, yy, zz);
01002         ve = set_vector(sn, cs, 0.0);
01003         circle3d(vp, vo, ve, ra, cc, ON);
01004     }
01005     vz = set_vector((vp.xs-1)/2., (vp.ys-1)/2., (vp.zs-1)/2.);
01006     ex = unit_vector(ex);
01007
01008     local2world(gd, vp, ox, vz, ex, NULL, NULL);
01009     free(vp.gp);
01010     return;
01011 }
| void triangle | ( | WSGraph | vp, | |
| int | x1, | |||
| int | y1, | |||
| int | x2, | |||
| int | y2, | |||
| int | x3, | |||
| int | y3, | |||
| int | cc, | |||
| int | mode | |||
| ) |
void triangle(WSGraph vp, int x1, int y1, int x2, int y2, int x3, int y3, int cc, int mode)
2Dの三角形の描画.
点(x1,y1),(x2,y2),(x3,y3)の三点を頂点とした三角形を描く.
線の濃度は cc. modeが 1以上なら,三角形の内部を塗りつぶす.
- Parameters:
-
vp 操作対象となるグラフィックデータ構造体. (x1,y1),(x2,y2),(x3,y3) 三角形の頂点の座標. cc 線の濃度. mode ON なら三角形の内部の0〜ccをccで塗りつぶす.
- 使用例
Definition at line 536 of file graph.c.
References isinctri(), line(), Max, Min, ON, and Px.
00537 {
00538     line(vp, x1, y1, x2, y2, cc);
00539     line(vp, x2, y2, x3, y3, cc);
00540     line(vp, x3, y3, x1, y1, cc);
00541
00542     if (mode==ON) {
00543         int i, j, minx, miny, maxx, maxy;
00544         minx = maxx = x1;
00545         miny = maxy = y1;
00546         minx = Min(x2, minx);
00547         minx = Min(x3, minx);
00548         miny = Min(y2, miny);
00549         miny = Min(y3, miny);
00550         maxx = Max(x2, maxx);
00551         maxx = Max(x3, maxx);
00552         maxy = Max(y2, maxy);
00553         maxy = Max(y3, maxy);
00554
00555         for (j=miny; j<=maxy; j++) {
00556             for (i=minx; i<=maxx; i++) {
00557                 if (isinctri(x1, y1, x2, y2, x3, y3, i, j)) Px(vp, i, j) = cc;
00558             }
00559         }
00560     }
00561     return;
00562 }
WSGraph x_reverse_wsg(WSGraph vp)
グラフィックデータの x軸を反転させる.
- Parameters:
-
vp 操作対象となるグラフィックデータ構造体.
- Returns:
- 反転したグラフィックデータ.
Definition at line 1097 of file graph.c.
References WSGraph::gp, JBXL_GRAPH_MEMORY_ERROR, make_WSGraph(), WSGraph::state, WSGraph::xs, and WSGraph::ys.
01098 {
01099     int  i, j, cy;
01100     WSGraph  wp;
01101
01102     wp = make_WSGraph(vp.xs, vp.ys, 1);
01103     if (wp.gp==NULL) {
01104         memset(&wp, 0, sizeof(WSGraph));
01105         wp.state = JBXL_GRAPH_MEMORY_ERROR;
01106         return wp;
01107     }
01108
01109     for (j=0; j<vp.ys; j++) {
01110         cy = j*vp.xs;
01111         for (i=0; i<vp.xs; i++) {
01112             wp.gp[cy +i] = vp.gp[cy + vp.xs - 1 - i];
01113         }
01114     }
01115     return wp;
01116 }
WSGraph zoom_WSGraph(WSGraph vp, int zm, int mode)
グラフィックデータ拡大する.
- Parameters:
-
vp 変換する Word型単純グラフィックデータ. zm 倍率. mode モード.1: 線形補間拡大,その他: 単純拡大
- Returns:
- 拡大したグラフィックデータ.
Definition at line 1271 of file graph.c.
References WSGraph::gp, JBXL_GRAPH_IVDARG_ERROR, JBXL_GRAPH_MEMORY_ERROR, make_WSGraph(), WSGraph::state, WSGraph::xs, and WSGraph::ys.
01272 {
01273     WSGraph  vx;
01274     int  i, j, k, l, m, n;
01275     sWord ws, wt;
01276
01277     memset(&vx, 0, sizeof(WSGraph));
01278     if (zm<1) {
01279         vx.state = JBXL_GRAPH_IVDARG_ERROR;
01280         return vx;
01281     }
01282
01283     vx = make_WSGraph(vp.xs*zm, vp.ys*zm, 1);
01284     if (vx.gp==NULL) {
01285         memset(&vx, 0, sizeof(WSGraph));
01286         vx.state = JBXL_GRAPH_MEMORY_ERROR;
01287         return vx;
01288     }
01289
01290     if (mode==1){
01291         for(j=0; j<vp.ys; j++) {
01292             for(i=0; i<vp.xs; i++) {
01293                 m = i + j*vp.xs;
01294                 n = (i + j*vx.xs)*zm;
01295                 if(i==vp.xs-1) wt = 0;
01296                 else           wt = (vp.gp[m+1] - vp.gp[m])/zm;
01297                 if(j==vp.ys-1) ws = 0;
01298                 else           ws = (vp.gp[m+vp.xs] - vp.gp[m])/zm;
01299
01300                 for(k=0; k<zm; k++) {
01301                     for(l=0; l<zm; l++) {
01302                         vx.gp[n+l+k*vx.xs] = ws*k + wt*l + vp.gp[m];
01303                     }
01304                 }
01305             }
01306         }
01307     }
01308     else {
01309         for(j=0; j<vp.ys; j++) {
01310             for(i=0; i<vp.xs; i++) {
01311                 m = i + j*vp.xs;
01312                 n = (i + j*vx.xs)*zm;
01313                 for(k=0; k<zm; k++) {
01314                     for(l=0; l<zm; l++) {
01315                         vx.gp[n+l+k*vx.xs] = vp.gp[m];
01316                     }
01317                 }
01318             }
01319         }
01320     }
01321     return vx;
01322 }