gLib/gmt.h File Reference
グラフィック用数学ライブラリ&フィルタ ヘッダ More...
#include "gdata.h"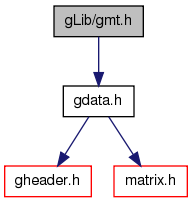
Go to the source code of this file.
Detailed Description
- Version:
- 3.0
Definition in file gmt.h.
Define Documentation
| #define FLAT 0x0100 |
Definition at line 36 of file gmt.h.
Referenced by curv2WSGraph(), and WSCurve().
| #define MINIMAL 0x0020 |
Definition at line 33 of file gmt.h.
Referenced by curv2WSGraph(), and WSCurve().
| #define NONE_SHAPE 0x0001 |
Definition at line 28 of file gmt.h.
Referenced by curv2WSGraph(), and WSCurve().
| #define PEAK 0x0002 |
Definition at line 29 of file gmt.h.
Referenced by curv2WSGraph(), and WSCurve().
| #define PIT 0x0004 |
Definition at line 30 of file gmt.h.
Referenced by curv2WSGraph(), and WSCurve().
| #define RIDGE 0x0040 |
Definition at line 34 of file gmt.h.
Referenced by curv2WSGraph(), and WSCurve().
| #define SADDLE_RIDGE 0x0008 |
Definition at line 31 of file gmt.h.
Referenced by curv2WSGraph(), and WSCurve().
| #define SADDLE_VALLEY 0x0010 |
Definition at line 32 of file gmt.h.
Referenced by curv2WSGraph(), and WSCurve().
| #define VALLEY 0x0080 |
Definition at line 35 of file gmt.h.
Referenced by curv2WSGraph(), and WSCurve().
Function Documentation
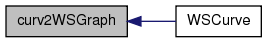
WSGraph curv2WSGraph(VSGraph xp)
3次元曲率データから曲面の形状を判定する.
- Parameters:
-
xp 操作対象となる3次元曲率の入ったグラフィックデータ.
- Returns:
- 曲面の形状情報を代入した sWord型グラフィックデータ.
- Note:
- 曲面の形状の種類は
PEAK, PIT, SADDLE_RIDGE, SADDLE_VALLEY, NONE_SHAPE, MINIMAL, RIDGE, VALLEY, FLAT
Definition at line 1432 of file gmt.c.
References FLAT, WSGraph::gp, VSGraph::gp, JBXL_GRAPH_NODATA_ERROR, make_WSGraph(), MINIMAL, NONE_SHAPE, PEAK, PIT, RIDGE, SADDLE_RIDGE, SADDLE_VALLEY, WSGraph::state, VALLEY, vector::x, WSGraph::xs, VSGraph::xs, vector::y, WSGraph::ys, VSGraph::ys, WSGraph::zs, and VSGraph::zs.
Referenced by WSCurve().
01433 {
01434     int  i;
01435     WSGraph vp;
01436     double  K, H;
01437
01438     memset(&vp, 0, sizeof(WSGraph));
01439     if (xp.gp==NULL) {
01440         vp.state = JBXL_GRAPH_NODATA_ERROR;
01441         return vp;
01442     }
01443
01444     vp = make_WSGraph(xp.xs, xp.ys, xp.zs);
01445     if (vp.gp==NULL) return vp;
01446
01447     for (i=0; i<vp.xs*vp.ys*vp.zs; i++) {
01448         K = xp.gp[i].x;
01449         H = xp.gp[i].y;
01450         if      (K>0  && H<0)  vp.gp[i] = PEAK;
01451         else if (K>0  && H>0)  vp.gp[i] = PIT;
01452         else if (K<0  && H<0)  vp.gp[i] = SADDLE_RIDGE;
01453         else if (K<0  && H>0)  vp.gp[i] = SADDLE_VALLEY;
01454         else if (K>0  && H==0) vp.gp[i] = NONE_SHAPE;
01455         else if (K<0  && H==0) vp.gp[i] = MINIMAL;
01456         else if (K==0 && H<0)  vp.gp[i] = RIDGE;
01457         else if (K==0 && H>0)  vp.gp[i] = VALLEY;
01458         else if (K==0 && H==0) vp.gp[i] = FLAT;
01459     }
01460
01461     return vp;
01462 }
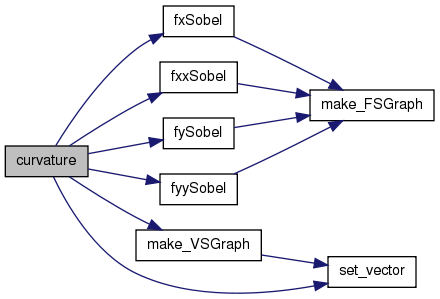
2Dグラフィックデータの3次元曲率を実数計算する.
- Parameters:
-
vp 計算対象となるグラフィックデータ構造体.
- Returns:
- 3次元曲率を代入した vector型グラフィックデータ(K,Hの2次元).
Definition at line 1356 of file gmt.c.
References free_VSGraph, freeNull, fxSobel(), fxxSobel(), fySobel(), fyySobel(), VSGraph::gp, FSGraph::gp, JBXL_GRAPH_ERROR, JBXL_GRAPH_IVDARG_ERROR, JBXL_GRAPH_NODATA_ERROR, make_VSGraph(), set_vector(), VSGraph::state, FSGraph::xs, FSGraph::ys, and FSGraph::zs.
Referenced by WSCurve().
01357 {
01358     int   i;
01359     double K, H, d;
01360     double Ix, Ixx, Iy, Iyy, Ixy;
01361     FSGraph px, py, pxy, pxx, pyy;
01362     VSGraph pp;
01363
01364     memset(&pp, 0, sizeof(VSGraph));
01365     if (vp.gp==NULL) {
01366         pp.state = JBXL_GRAPH_NODATA_ERROR;
01367         return pp;
01368     }
01369
01370     if (vp.zs>1) {
01371         //fprintf(stderr,"CURVATURE: z dimension is > 1.\n");
01372         pp.state = JBXL_GRAPH_IVDARG_ERROR;
01373         return pp;
01374     }
01375
01376     pp = make_VSGraph(vp.xs, vp.ys, vp.zs);
01377     if (pp.gp==NULL) return pp;
01378
01379     px  = fxSobel(vp);
01380     py  = fySobel(vp);
01381     pxy = fySobel(px);
01382     pxx = fxxSobel(vp);
01383     pyy = fyySobel(vp);
01384
01385     if (px.gp==NULL||py.gp==NULL||pxy.gp==NULL||pxx.gp==NULL||pyy.gp==NULL) {
01386         freeNull(px.gp);
01387         freeNull(py.gp);
01388         freeNull(pxy.gp);
01389         freeNull(pxx.gp);
01390         freeNull(pyy.gp);
01391         free_VSGraph(&pp);
01392         pp.state = JBXL_GRAPH_ERROR;
01393         return pp;
01394     }
01395
01396     for (i=0; i<vp.xs*vp.ys; i++) {
01397         Ix  = px.gp[i];
01398         Iy  = py.gp[i];
01399         Ixy = pxy.gp[i];
01400         Ixx = pxx.gp[i];
01401         Iyy = pyy.gp[i];
01402         d   = 1. + Ix*Ix + Iy*Iy;
01403
01404         K = (Ixx*Iyy-Ixy*Ixy)/(d*d);
01405         H = (Ixx+Ixx*Iy*Iy+Iyy+Iyy*Ix*Ix-2*Ix*Ixy*Iy)/(2.*d*sqrt(d));
01406         pp.gp[i] = set_vector(K, H, 0.0);
01407     }
01408
01409     free(px.gp);
01410     free(py.gp);
01411     free(pxy.gp);
01412     free(pxx.gp);
01413     free(pyy.gp);
01414
01415     return pp;
01416 }
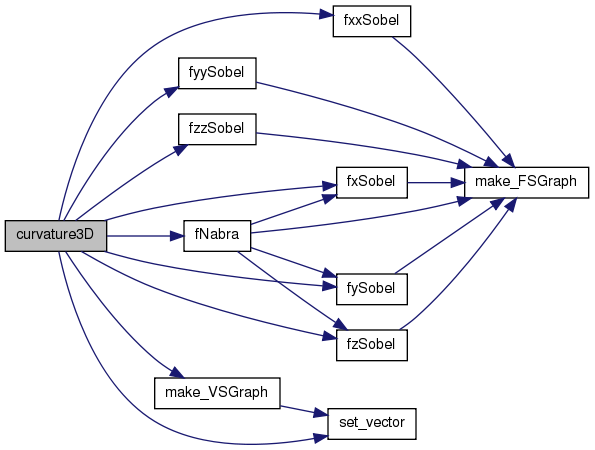
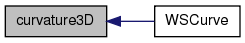
VSGraph curvature3D(FSGraph vp)
3Dグラフィックデータの4次元曲率を実数計算する.
- Parameters:
-
vp 計算対象となるグラフィックデータ構造体.
- Returns:
- 4次元曲率を代入した vector型グラフィックデータ(K,Hの2次元).
Definition at line 1254 of file gmt.c.
References fNabra(), free_VSGraph, freeNull, fxSobel(), fxxSobel(), fySobel(), fyySobel(), fzSobel(), fzzSobel(), VSGraph::gp, FSGraph::gp, JBXL_GRAPH_ERROR, JBXL_GRAPH_IVDARG_ERROR, JBXL_GRAPH_NODATA_ERROR, make_VSGraph(), set_vector(), VSGraph::state, FSGraph::xs, FSGraph::ys, and FSGraph::zs.
Referenced by WSCurve().
01255 {
01256     int  i;
01257     double alph, beta, gamm, K, H;
01258     double fx, fy, fz, fxy, fyz, fzx, fxx, fyy, fzz, nb;
01259     FSGraph px, py, pz, pxy, pyz, pzx, pxx, pyy, pzz, nab;
01260     VSGraph pp;
01261
01262     memset(&pp, 0, sizeof(VSGraph));
01263     if (vp.gp==NULL) {
01264         pp.state = JBXL_GRAPH_NODATA_ERROR;
01265         return pp;
01266     }
01267
01268     if (vp.zs<5) {
01269         //fprintf(stderr,"CURVATURE3D: z dimension is < 5.\n");
01270         pp.state = JBXL_GRAPH_IVDARG_ERROR;
01271         return pp;
01272     }
01273
01274     pp = make_VSGraph(vp.xs, vp.ys, vp.zs);
01275     if (pp.gp==NULL) return pp;
01276
01277     nab = fNabra(vp);
01278     px  = fxSobel(vp);
01279     py  = fySobel(vp);
01280     pz  = fzSobel(vp);
01281     pxy = fySobel(px);
01282     pyz = fzSobel(py);
01283     pzx = fxSobel(pz);
01284     pxx = fxxSobel(vp);
01285     pyy = fyySobel(vp);
01286     pzz = fzzSobel(vp);
01287
01288     if (nab.gp==NULL || px.gp==NULL  || py.gp==NULL  || pz.gp==NULL  ||
01289                         pxy.gp==NULL || pyz.gp==NULL || pzx.gp==NULL ||
01290                         pxx.gp==NULL || pyy.gp==NULL || pzz.gp==NULL) {
01291         freeNull(px.gp);
01292         freeNull(py.gp);
01293         freeNull(pz.gp);
01294         freeNull(pxy.gp);
01295         freeNull(pyz.gp);
01296         freeNull(pzx.gp);
01297         freeNull(pxx.gp);
01298         freeNull(pyy.gp);
01299         freeNull(pzz.gp);
01300         freeNull(nab.gp);
01301         free_VSGraph(&pp);
01302         pp.state = JBXL_GRAPH_ERROR;
01303         return pp;
01304     }
01305
01306     for (i=0; i<vp.xs*vp.ys*vp.zs; i++) {
01307         nb  = nab.gp[i];
01308         fx  = px.gp[i];
01309         fy  = py.gp[i];
01310         fz  = pz.gp[i];
01311         fxy = pxy.gp[i];
01312         fyz = pyz.gp[i];
01313         fzx = pzx.gp[i];
01314         fxx = pxx.gp[i];
01315         fyy = pyy.gp[i];
01316         fzz = pzz.gp[i];
01317
01318         if (nb*(fx*fx+fy*fy) !=0) {
01319             alph = (2*fx*fy*fxy - fx*fx*fyy - fy*fy*fxx)/(fx*fx+fy*fy);
01320             beta = (2*fz*(fx*fx+fy*fy)*(fx*fzx+fy*fyz) - 2*fx*fy*fz*fz*fxy
01321                         - fx*fx*fz*fz*fxx - fy*fy*fz*fz*fyy
01322                         - (fx*fx+fy*fy)*(fx*fx+fy*fy)*fzz)/(nb*nb*(fx*fx+fy*fy));
01323             gamm = ((fx*fx+fy*fy)*(fy*fzx-fx*fyz) + (fx*fx-fy*fy)*fz*fxy
01324                         - fx*fy*fz*(fxx-fyy))/(nb*(fx*fx+fy*fy));
01325
01326             K = alph*beta - gamm*gamm;
01327             H = (alph + beta)/2;
01328             pp.gp[i] = set_vector(K, H, 0.0);
01329         }
01330     }
01331
01332     free(px.gp);
01333     free(py.gp);
01334     free(pz.gp);
01335     free(pxy.gp);
01336     free(pyz.gp);
01337     free(pzx.gp);
01338     free(pxx.gp);
01339     free(pyy.gp);
01340     free(pzz.gp);
01341     free(nab.gp);
01342
01343     return pp;
01344 }
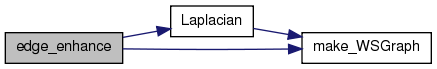
WSGraph edge_enhance(WSGraph gd, int mode)
2Dグラフィックデータのラプラシアンを使ったエッジ強調.
- Parameters:
-
gd 計算対象となるグラフィックデータ構造体. mode モード.
4: 4近傍ラプラシアン.
8: 8近傍ラプラシアン 3x3
その他: Sobelのラプラシアン(24近傍) 5x5
- Returns:
- 処理されたグラフィックデータ.
Definition at line 1544 of file gmt.c.
References WSGraph::gp, JBXL_GRAPH_NODATA_ERROR, Laplacian(), make_WSGraph(), WSGraph::state, WSGraph::xs, and WSGraph::ys.
01545 {
01546     int  i;
01547     WSGraph la, vp;
01548
01549     memset(&vp, 0, sizeof(WSGraph));
01550     if (gd.gp==NULL) {
01551         vp.state = JBXL_GRAPH_NODATA_ERROR;
01552         return vp;
01553     }
01554
01555     la = Laplacian(gd, mode);
01556     if (la.gp==NULL) return la;
01557
01558     vp = make_WSGraph(gd.xs, gd.ys, 1);
01559     if (vp.gp==NULL) return vp;
01560
01561     for (i=0; i<vp.xs*vp.ys; i++) vp.gp[i] = gd.gp[i] - la.gp[i];
01562     return vp;
01563 }
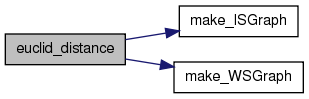
WSGraph euclid_distance(WSGraph vp, int* rr, int bc)
WSGグラフィック上を2値化し,各点における輝度値0の点からのユークリッド距離の最小を求める.
- Parameters:
-
vp 操作対象となるグラフィックデータ構造体. *rr 指定しない.画像中のユークリッド距離の最大値が入る. bc 輝度値の2値化の値.これより小さいものは0,これ以上は1.
- Returns:
- 輝度値の代わりにユークリッド距離が記入されたグラフィックデータ.
Definition at line 1913 of file gmt.c.
References free_WSGraph, ISGraph::gp, WSGraph::gp, JBXL_GRAPH_NODATA_ERROR, Lxt, make_ISGraph(), make_WSGraph(), Max, Min, ISGraph::state, WSGraph::state, Vxt, WSGraph::xs, WSGraph::ys, and WSGraph::zs.
01914 {
01915     int  i, j, k, l;
01916     int  df, db, d, w;
01917     int  rmax, rstart, rend;
01918     WSGraph wp;
01919     ISGraph pp, buff;
01920
01921     memset(&wp, 0, sizeof(WSGraph));
01922     if (vp.gp==NULL) {
01923         wp.state = JBXL_GRAPH_NODATA_ERROR;
01924         return wp;
01925     }
01926
01927     wp = make_WSGraph(vp.xs, vp.ys, vp.zs);
01928     if (wp.gp==NULL) return wp;
01929
01930     pp = make_ISGraph(vp.xs, vp.ys, vp.zs);
01931     if (pp.gp==NULL) {
01932         free_WSGraph(&wp);
01933         wp.state = pp.state;
01934         return wp;
01935     }
01936
01937     for (i=0; i<vp.xs*vp.ys*vp.zs; i++) {
01938          if (vp.gp[i]>=bc) pp.gp[i] = 1;
01939          else              pp.gp[i] = 0;
01940     }
01941
01942     for (k=1; k<=vp.zs; k++) {
01943         for (j=1; j<=vp.ys; j++) {
01944             df = vp.xs;
01945             for (i=1; i<=vp.xs; i++) {
01946                 if (Vxt(pp, i, j, k)!=0) df = df + 1;
01947                 else                     df = 0;
01948                 Vxt(pp, i, j, k) = df*df;
01949             }
01950         }
01951     }
01952
01953     for (k=1; k<=vp.zs; k++) {
01954         for (j=1; j<=vp.ys; j++) {
01955             db = vp.xs;
01956             for (i=vp.xs; i>=1; i--) {
01957                 if (Vxt(pp, i, j, k)!=0) db = db + 1;
01958                 else                     db = 0;
01959                 Vxt(pp, i, j, k) = Min(Vxt(pp, i, j, k), db*db);
01960             }
01961         }
01962     }
01963
01964     buff = make_ISGraph(vp.ys, 1, 1);
01965     for (k=1; k<=vp.zs; k++) {
01966         for (i=1; i<=vp.xs; i++) {
01967             for (j=1; j<=vp.ys; j++) {
01968                 Lxt(buff, j) = Vxt(pp, i, j, k);
01969             }
01970             for (j=1; j<=vp.ys; j++) {
01971                 d = Lxt(buff, j);
01972                 if (d!=0) {
01973                     rmax   = (int)sqrt((double)d) + 1;
01974                     rstart = Min(rmax, j-1);
01975                     rend   = Min(rmax, vp.ys-j);
01976                     for (l=-rstart; l<=rend; l++) {
01977                         w = Lxt(buff, j+l) + l*l;
01978                         if (w<d) d = w;
01979                     }
01980                 }
01981                 Vxt(pp, i, j, k) = d;
01982             }
01983         }
01984     }
01985     free(buff.gp);
01986
01987     *rr = 0;
01988     buff = make_ISGraph(vp.zs, 1, 1);
01989     for (j=1; j<=vp.ys; j++) {
01990         for (i=1; i<=vp.xs; i++) {
01991             for (k=1; k<=vp.zs; k++) {
01992                 Lxt(buff, k) = Vxt(pp, i, j, k);
01993             }
01994             for (k=1; k<=vp.zs; k++) {
01995                 d = Lxt(buff, k);
01996                 if (d!=0) {
01997                     rmax   = (int)sqrt((double)d) + 1;
01998                     rstart = Min(rmax, k-1);
01999                     rend   = Min(rmax, vp.zs-k);
02000                     for (l=-rstart; l<=rend; l++) {
02001                         w = Lxt(buff, k+l) + l*l;
02002                         if (w<d) d = w;
02003                     }
02004                     *rr = Max(*rr, d);
02005                 }
02006                 Vxt(pp, i, j, k) = d;
02007             }
02008         }
02009     }
02010     free(buff.gp);
02011
02012     for (i=0; i<wp.xs*wp.ys*wp.zs; i++) {
02013         wp.gp[i] = (sWord)pp.gp[i];
02014         if (pp.gp[i]>32767) {
02015             fprintf(stderr,"EUCLID_DISTANCE: WARNING: distance is too long = %d!\n",pp.gp[i]);
02016         }
02017     }
02018     free(pp.gp);
02019
02020     return wp;
02021 }
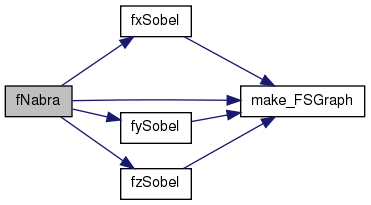
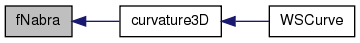
WSGraph fNabra(WSGraph vp)
グラフィックデータの ナブラの絶対値を実数計算する(Sobel). 精度が上昇するが時間がかかる.
- Parameters:
-
vp 計算対象となるグラフィックデータ構造体.
- Returns:
- ナブラ.double型グラフィックデータ.
Definition at line 1180 of file gmt.c.
References free_FSGraph, fxSobel(), fySobel(), fzSobel(), FSGraph::gp, JBXL_GRAPH_NODATA_ERROR, make_FSGraph(), FSGraph::state, FSGraph::xs, FSGraph::ys, and FSGraph::zs.
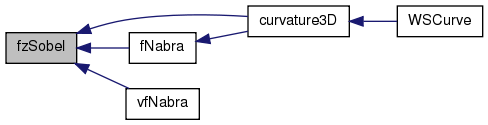
Referenced by curvature3D().
01181 {
01182     int    i, xs, ys, zs;
01183     double xx, yy, zz;
01184     FSGraph px, py, pz, pn;
01185
01186     memset(&pn, 0, sizeof(FSGraph));
01187     if (vp.gp==NULL) {
01188         pn.state = JBXL_GRAPH_NODATA_ERROR;
01189         return pn;
01190     }
01191
01192     xs = vp.xs;
01193     ys = vp.ys;
01194     zs = vp.zs;
01195     pn = make_FSGraph(xs, ys, zs);
01196     if (pn.gp==NULL) return pn;
01197
01198     px = fxSobel(vp);
01199     if (px.gp==NULL) {
01200         free_FSGraph(&pn);
01201         pn.state = px.state;
01202         return pn;
01203     }
01204     py = fySobel(vp);
01205     if (py.gp==NULL) {
01206         free_FSGraph(&pn);
01207         free(px.gp);
01208         pn.state = py.state;
01209         return pn;
01210     }
01211
01212     if (vp.zs<3) {
01213         for (i=0; i<xs*ys; i++) {
01214             xx = px.gp[i];
01215             yy = py.gp[i];
01216             pn.gp[i] = sqrt(xx*xx + yy*yy);
01217         }
01218     }
01219     else {
01220         pz = fzSobel(vp);
01221         if (pz.gp==NULL) {
01222             free_FSGraph(&pn);
01223             free(px.gp);
01224             free(py.gp);
01225             pn.state = pz.state;
01226             return pn;
01227         }
01228
01229         for (i=0; i<xs*ys*zs; i++) {
01230             xx = px.gp[i];
01231             yy = py.gp[i];
01232             zz = pz.gp[i];
01233             pn.gp[i] = sqrt(xx*xx + yy*yy + zz*zz);
01234         }
01235         free(pz.gp);
01236     }
01237
01238     free(px.gp);
01239     free(py.gp);
01240
01241     return pn;
01242 }
グラフィックデータの x方向微分(Sobel)を実数計算する. 精度が上昇するが時間がかかる.
- Parameters:
-
vp 計算対象となる double型グラフィックデータ構造体.
- Returns:
- 処理されたグラフィックデータ.
Definition at line 144 of file gmt.c.
References FSGraph::gp, JBXL_GRAPH_NODATA_ERROR, make_FSGraph(), FSGraph::state, Vx, FSGraph::xs, FSGraph::ys, and FSGraph::zs.
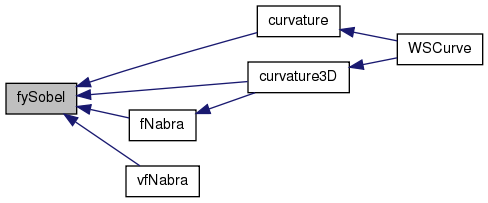
Referenced by curvature(), curvature3D(), fNabra(), and vfNabra().
00145 {
00146     int    i, j, k;
00147     double da, db, dc, dd, de, nr;
00148     FSGraph xp;
00149
00150     memset(&xp, 0, sizeof(FSGraph));
00151     if (vp.gp==NULL) {
00152         xp.state = JBXL_GRAPH_NODATA_ERROR;
00153         return xp;
00154     }
00155
00156     if (vp.zs<=0) vp.zs = 1;
00157     xp = make_FSGraph(vp.xs, vp.ys, vp.zs);
00158     if (xp.gp==NULL) return xp;
00159
00160     for (k=0; k<vp.zs; k++) {
00161         for (j=1; j<vp.ys-1; j++) {
00162             for (i=1; i<vp.xs-1; i++) {
00163                 da = Vx(vp, i+1, j-1, k) - Vx(vp, i-1, j-1, k);
00164                 db = Vx(vp, i+1, j,   k) - Vx(vp, i-1, j,   k);
00165                 dc = Vx(vp, i+1, j+1, k) - Vx(vp, i-1, j+1, k);
00166                 if (k==0 || k==vp.zs-1) {
00167                     dd = de = 0.;
00168                     nr = 8.;
00169                 }
00170                 else {
00171                     dd = Vx(vp, i+1, j, k-1) - Vx(vp, i-1, j, k-1);
00172                     de = Vx(vp, i+1, j, k+1) - Vx(vp, i-1, j, k+1);
00173                     nr = 12.;
00174                 }
00175                 Vx(xp, i, j, k) = (da + 2.*db + dc + dd + de)/nr;
00176             }
00177         }
00178     }
00179
00180     return xp;
00181 }


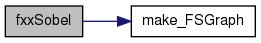
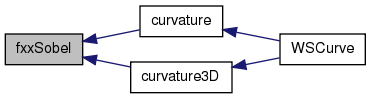
グラフィックデータの x方向の2階微分(Sobel)を実数計算する. 精度が上昇するが時間がかかる.
- Parameters:
-
vp 計算対象となる double型グラフィックデータ構造体.
- Returns:
- 処理されたグラフィックデータ.
Definition at line 502 of file gmt.c.
References FSGraph::gp, JBXL_GRAPH_NODATA_ERROR, make_FSGraph(), FSGraph::state, FSGraph::xs, FSGraph::ys, and FSGraph::zs.
Referenced by curvature(), and curvature3D().
00503 {
00504     int  x, y, z, xs, ys, zs, cx, cy, cz, ps;
00505     double da, db, dc, dd, de;
00506     double df, dg, dh, di, dj, dk, dl, dm;
00507     FSGraph px;
00508
00509     memset(&px, 0, sizeof(FSGraph));
00510     if (vp.gp==NULL) {
00511         px.state = JBXL_GRAPH_NODATA_ERROR;
00512         return px;
00513     }
00514
00515     xs = vp.xs;
00516     ys = vp.ys;
00517     zs = vp.zs;
00518     ps = xs*ys;
00519
00520     if (zs<5) {
00521         px = make_FSGraph(xs, ys, 1);
00522         if (px.gp==NULL) return px;
00523
00524         for (y=2; y<ys-2; y++) {
00525             cy = y*xs;
00526             for (x=2; x<xs-2; x++) {
00527                 cx = cy + x;
00528                 da = vp.gp[cx-2*xs+2] - 2*vp.gp[cx-2*xs] + vp.gp[cx-2*xs-2];
00529                 db = vp.gp[cx  -xs+2] - 2*vp.gp[cx  -xs] + vp.gp[cx  -xs-2];
00530                 dc = vp.gp[cx     +2] - 2*vp.gp[cx]      + vp.gp[cx     -2];
00531                 dd = vp.gp[cx  +xs+2] - 2*vp.gp[cx  +xs] + vp.gp[cx  +xs-2];
00532                 de = vp.gp[cx+2*xs+2] - 2*vp.gp[cx+2*xs] + vp.gp[cx+2*xs-2];
00533                 px.gp[cx] = (da + 4*db + 6*dc + 4*dd + de)/64.;
00534             }
00535         }
00536     }
00537
00538     else {
00539         px = make_FSGraph(xs, ys, zs);
00540         if (px.gp==NULL) return px;
00541
00542         for (z=2; z<zs-2; z++) {
00543             cz = z*ps;
00544             for (y=2; y<ys-2; y++) {
00545                 cy = cz + y*xs;
00546                 for (x=2; x<xs-2; x++) {
00547                     cx = cy + x;
00548                     da = vp.gp[cx   +2]    - 2*vp.gp[cx]       + vp.gp[cx-2];
00549                     db = vp.gp[cx+xs+2]    - 2*vp.gp[cx+xs]    + vp.gp[cx+xs-2];
00550                     dc = vp.gp[cx-xs+2]    - 2*vp.gp[cx-xs]    + vp.gp[cx-xs-2];
00551                     dd = vp.gp[cx+ps+2]    - 2*vp.gp[cx+ps]    + vp.gp[cx+ps-2];
00552                     de = vp.gp[cx-ps+2]    - 2*vp.gp[cx-ps]    + vp.gp[cx-ps-2];
00553                     df = vp.gp[cx+xs+ps+2] - 2*vp.gp[cx+xs+ps] + vp.gp[cx+xs+ps-2];
00554                     dg = vp.gp[cx+xs-ps+2] - 2*vp.gp[cx+xs-ps] + vp.gp[cx+xs-ps-2];
00555                     dh = vp.gp[cx-xs+ps+2] - 2*vp.gp[cx-xs+ps] + vp.gp[cx-xs+ps-2];
00556                     di = vp.gp[cx-xs-ps+2] - 2*vp.gp[cx-xs-ps] + vp.gp[cx-xs-ps-2];
00557                     dj = vp.gp[cx+2*xs+2]  - 2*vp.gp[cx+2*xs]  + vp.gp[cx+2*xs-2];
00558                     dk = vp.gp[cx-2*xs+2]  - 2*vp.gp[cx-2*xs]  + vp.gp[cx-2*xs-2];
00559                     dl = vp.gp[cx+2*ps+2]  - 2*vp.gp[cx+2*ps]  + vp.gp[cx+2*ps-2];
00560                     dm = vp.gp[cx-2*ps+2]  - 2*vp.gp[cx-2*ps]  + vp.gp[cx-2*ps-2];
00561                     px.gp[cx] = (8*da+4*(db+dc+dd+de)+2*(df+dg+dh+di)+dj+dk+dl+dm)/144.;
00562                 }
00563             }
00564         }
00565     }
00566
00567     return px;
00568 }
グラフィックデータの y方向微分(Sobel)を実数計算する. 精度が上昇するが時間がかかる.
- Parameters:
-
vp 計算対象となる double型グラフィックデータ構造体.
- Returns:
- 処理されたグラフィックデータ.
Definition at line 243 of file gmt.c.
References FSGraph::gp, JBXL_GRAPH_NODATA_ERROR, make_FSGraph(), FSGraph::state, Vx, FSGraph::xs, FSGraph::ys, and FSGraph::zs.
Referenced by curvature(), curvature3D(), fNabra(), and vfNabra().
00244 {
00245     int    i, j, k;
00246     double da, db, dc, dd, de, nr;
00247     FSGraph xp;
00248
00249     memset(&xp, 0, sizeof(FSGraph));
00250     if (vp.gp==NULL) {
00251         xp.state = JBXL_GRAPH_NODATA_ERROR;
00252         return xp;
00253     }
00254
00255     if (vp.zs<=0) vp.zs = 1;
00256     xp = make_FSGraph(vp.xs, vp.ys, vp.zs);
00257     if (xp.gp==NULL) return xp;
00258
00259     for (k=0; k<vp.zs; k++) {
00260         for (j=1; j<vp.ys-1; j++) {
00261             for (i=1; i<vp.xs-1; i++) {
00262                 da = Vx(vp, i-1, j+1, k) - Vx(vp, i-1, j-1, k);
00263                 db = Vx(vp, i,   j+1, k) - Vx(vp, i,   j-1, k);
00264                 dc = Vx(vp, i+1, j+1, k) - Vx(vp, i+1, j-1, k);
00265                 if (k==0 || k==vp.zs-1) {
00266                     dd = de = 0.;
00267                     nr = 8.;
00268                 }
00269                 else {
00270                     dd = Vx(vp, i, j+1, k-1) - Vx(vp, i, j-1, k-1);
00271                     de = Vx(vp, i, j+1, k+1) - Vx(vp, i, j-1, k+1);
00272                     nr = 12.;
00273                 }
00274                 Vx(xp, i, j, k) = (da + 2.*db + dc + dd + de)/nr;
00275             }
00276         }
00277     }
00278
00279     return xp;
00280 }
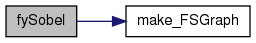
グラフィックデータの y方向の2階微分(Sobel)を実数計算する. 精度が上昇するが時間がかかる.
- Parameters:
-
vp 計算対象となる double型グラフィックデータ構造体.
- Returns:
- 処理されたグラフィックデータ.
Definition at line 658 of file gmt.c.
References FSGraph::gp, JBXL_GRAPH_NODATA_ERROR, make_FSGraph(), FSGraph::state, FSGraph::xs, FSGraph::ys, and FSGraph::zs.
Referenced by curvature(), and curvature3D().
00659 {
00660     int  x, y, z, xs, ys, zs, cx, cy, cz, ps;
00661     double da, db, dc, dd, de;
00662     double df, dg, dh, di, dj, dk, dl, dm;
00663     FSGraph py;
00664
00665     memset(&py, 0, sizeof(FSGraph));
00666     if (vp.gp==NULL) {
00667         py.state = JBXL_GRAPH_NODATA_ERROR;
00668         return py;
00669     }
00670
00671     xs = vp.xs;
00672     ys = vp.ys;
00673     zs = vp.zs;
00674     ps = xs*ys;
00675
00676     if (zs<5) {
00677         py = make_FSGraph(xs, ys, 1);
00678         if (py.gp==NULL) return py;
00679
00680         for (y=2; y<ys-2; y++) {
00681             cy = y*xs;
00682             for (x=2; x<xs-2; x++) {
00683                 cx = cy + x;
00684                 da = vp.gp[cx+2*xs-2] - 2*vp.gp[cx-2] + vp.gp[cx-2*xs-2];
00685                 db = vp.gp[cx+2*xs-1] - 2*vp.gp[cx-1] + vp.gp[cx-2*xs-1];
00686                 dc = vp.gp[cx+2*xs]   - 2*vp.gp[cx]   + vp.gp[cx-2*xs];
00687                 dd = vp.gp[cx+2*xs+1] - 2*vp.gp[cx+1] + vp.gp[cx-2*xs+1];
00688                 de = vp.gp[cx+2*xs+2] - 2*vp.gp[cx+2] + vp.gp[cx-2*xs+2];
00689                 py.gp[cx] = (da + 4*db + 6*dc + 4*dd + de)/64.;
00690             }
00691         }
00692     }
00693     else {
00694         py = make_FSGraph(xs, ys, zs);
00695         if (py.gp==NULL) return py;
00696
00697         for (z=2; z<zs-2; z++) {
00698             cz = z*ps;
00699             for (y=2; y<ys-2; y++) {
00700                 cy = cz + y*xs;
00701                 for (x=2; x<xs-2; x++) {
00702                     cx = cy + x;
00703                     da = vp.gp[cx+2*xs]      - 2*vp.gp[cx]      + vp.gp[cx-2*xs];
00704                     db = vp.gp[cx+1+2*xs]    - 2*vp.gp[cx+1]    + vp.gp[cx+1-2*xs];
00705                     dc = vp.gp[cx-1+2*xs]    - 2*vp.gp[cx-1]    + vp.gp[cx-1-2*xs];
00706                     dd = vp.gp[cx+ps+2*xs]   - 2*vp.gp[cx+ps]   + vp.gp[cx+ps-2*xs];
00707                     de = vp.gp[cx-ps+2*xs]   - 2*vp.gp[cx-ps]   + vp.gp[cx-ps-2*xs];
00708                     df = vp.gp[cx+1+ps+2*xs] - 2*vp.gp[cx+1+ps] + vp.gp[cx+1+ps-2*xs];
00709                     dg = vp.gp[cx+1-ps+2*xs] - 2*vp.gp[cx+1-ps] + vp.gp[cx+1-ps-2*xs];
00710                     dh = vp.gp[cx-1+ps+2*xs] - 2*vp.gp[cx-1+ps] + vp.gp[cx-1+ps-2*xs];
00711                     di = vp.gp[cx-1-ps+2*xs] - 2*vp.gp[cx-1-ps] + vp.gp[cx-1-ps-2*xs];
00712                     dj = vp.gp[cx+2+2*xs]    - 2*vp.gp[cx+2]    + vp.gp[cx+2-2*xs];
00713                     dk = vp.gp[cx-2+2*xs]    - 2*vp.gp[cx-2]    + vp.gp[cx-2-2*xs];
00714                     dl = vp.gp[cx+2*ps+2*xs] - 2*vp.gp[cx+2*ps] + vp.gp[cx+2*ps-2*xs];
00715                     dm = vp.gp[cx-2*ps+2*xs] - 2*vp.gp[cx-2*ps] + vp.gp[cx-2*ps-2*xs];
00716                     py.gp[cx] = (8*da+4*(db+dc+dd+de)+2*(df+dg+dh+di)+dj+dk+dl+dm)/144.;
00717                 }
00718             }
00719         }
00720     }
00721
00722     return py;
00723 }

グラフィックデータの z方向微分(Sobel)を実数計算する. 精度が上昇するが時間がかかる.
- Parameters:
-
vp 計算対象となる double型グラフィックデータ構造体.
- Returns:
- 処理されたグラフィックデータ.
Definition at line 358 of file gmt.c.
References FSGraph::gp, JBXL_GRAPH_IVDARG_ERROR, JBXL_GRAPH_NODATA_ERROR, make_FSGraph(), FSGraph::state, Vx, FSGraph::xs, FSGraph::ys, and FSGraph::zs.
Referenced by curvature3D(), fNabra(), and vfNabra().
00359 {
00360     int    i, j, k;
00361     double da, db, dc, dd, de;
00362     FSGraph xp;
00363
00364     memset(&xp, 0, sizeof(FSGraph));
00365     if (vp.gp==NULL) {
00366         xp.state = JBXL_GRAPH_NODATA_ERROR;
00367         return xp;
00368     }
00369
00370     if (vp.zs<=1) {
00371         //fprintf(stderr,"FZSOBEL: no 3D data inputed.\n");
00372         xp.state = JBXL_GRAPH_IVDARG_ERROR;
00373         return xp;
00374     }
00375
00376     xp = make_FSGraph(vp.xs, vp.ys, vp.zs);
00377     if (xp.gp==NULL) return xp;
00378
00379     for (k=1; k<vp.zs-1; k++) {
00380         for (j=1; j<vp.ys-1; j++) {
00381             for (i=1; i<vp.xs-1; i++) {
00382                 da = Vx(vp, i-1, j, k+1) - Vx(vp, i-1, j, k-1);
00383                 db = Vx(vp, i+1, j, k+1) - Vx(vp, i+1, j, k-1);
00384                 dc = Vx(vp, i,   j, k+1) - Vx(vp, i,   j, k-1);
00385                 dd = Vx(vp, i, j-1, k+1) - Vx(vp, i, j-1, k-1);
00386                 de = Vx(vp, i, j+1, k+1) - Vx(vp, i, j+1, k-1);
00387                 Vx(xp, i, j, k) = (da + db + 2.*dc + dd + de)/12.;
00388             }
00389         }
00390     }
00391
00392     for (j=1; j<vp.ys-1; j++) {
00393         for (i=1; i<vp.xs-1; i++) {
00394             da = Vx(vp, i-1, j, 1) - Vx(vp, i-1, j, 0);
00395             db = Vx(vp, i+1, j, 1) - Vx(vp, i+1, j, 0);
00396             dc = Vx(vp, i,   j, 1) - Vx(vp, i,   j, 0);
00397             dd = Vx(vp, i, j-1, 1) - Vx(vp, i, j-1, 0);
00398             de = Vx(vp, i, j+1, 1) - Vx(vp, i, j+1, 0);
00399             Vx(xp, i, j, 0) = (da + db + 2.*dc + dd + de)/12.;
00400
00401             da = Vx(vp, i-1, j, vp.zs-1) - Vx(vp, i-1, j, vp.zs-2);
00402             db = Vx(vp, i+1, j, vp.zs-1) - Vx(vp, i+1, j, vp.zs-2);
00403             dc = Vx(vp, i,   j, vp.zs-1) - Vx(vp, i,   j, vp.zs-2);
00404             dd = Vx(vp, i, j-1, vp.zs-1) - Vx(vp, i, j-1, vp.zs-2);
00405             de = Vx(vp, i, j+1, vp.zs-1) - Vx(vp, i, j+1, vp.zs-2);
00406             Vx(xp, i, j, vp.zs-1) = (da + db + 2.*dc + dd + de)/12.;
00407         }
00408     }
00409
00410     return xp;
00411 }

グラフィックデータの z方向の2階微分(Sobel)を実数計算する. 精度が上昇するが時間がかかる.
- Parameters:
-
vp 計算対象となる double型グラフィックデータ構造体.
- Returns:
- 処理されたグラフィックデータ.
Definition at line 843 of file gmt.c.
References FSGraph::gp, JBXL_GRAPH_IVDARG_ERROR, JBXL_GRAPH_NODATA_ERROR, make_FSGraph(), FSGraph::state, FSGraph::xs, FSGraph::ys, and FSGraph::zs.
Referenced by curvature3D().
00844 {
00845     int  x, y, z, xs, ys, zs, cx, cy, cz, ps;
00846     double da, db, dc, dd, de;
00847     double df, dg, dh, di, dj, dk, dl, dm;
00848     FSGraph pz;
00849
00850     memset(&pz, 0, sizeof(FSGraph));
00851     if (vp.gp==NULL) {
00852         pz.state = JBXL_GRAPH_NODATA_ERROR;
00853         return pz;
00854     }
00855
00856     if (vp.zs<5) {
00857         //fprintf(stderr,"FZZSOBEL: no 3D data inputed.\n");
00858         pz.state = JBXL_GRAPH_IVDARG_ERROR;
00859         return pz;
00860     }
00861
00862     xs = vp.xs;
00863     ys = vp.ys;
00864     zs = vp.zs;
00865     ps = xs*ys;
00866     pz = make_FSGraph(xs, ys, zs);
00867     if (pz.gp==NULL) return pz;
00868
00869     for (z=2; z<zs-2; z++) {
00870         cz = z*ps;
00871         for (y=2; y<ys-2; y++) {
00872             cy = cz + y*xs;
00873             for (x=2; x<xs-2; x++) {
00874                 cx = cy + x;
00875                 da = vp.gp[cx     +2*ps] - 2*vp.gp[cx]      + vp.gp[cx     -2*ps];
00876                 db = vp.gp[cx+1   +2*ps] - 2*vp.gp[cx+1]    + vp.gp[cx+1   -2*ps];
00877                 dc = vp.gp[cx-1   +2*ps] - 2*vp.gp[cx-1]    + vp.gp[cx-1   -2*ps];
00878                 dd = vp.gp[cx  +xs+2*ps] - 2*vp.gp[cx  +xs] + vp.gp[cx  +xs-2*ps];
00879                 de = vp.gp[cx  -xs+2*ps] - 2*vp.gp[cx  -xs] + vp.gp[cx  -xs-2*ps];
00880                 df = vp.gp[cx+1+xs+2*ps] - 2*vp.gp[cx+1+xs] + vp.gp[cx+1+xs-2*ps];
00881                 dg = vp.gp[cx+1-xs+2*ps] - 2*vp.gp[cx+1-xs] + vp.gp[cx+1-xs-2*ps];
00882                 dh = vp.gp[cx-1+xs+2*ps] - 2*vp.gp[cx-1+xs] + vp.gp[cx-1+xs-2*ps];
00883                 di = vp.gp[cx-1-xs+2*ps] - 2*vp.gp[cx-1-xs] + vp.gp[cx-1-xs-2*ps];
00884                 dj = vp.gp[cx+2   +2*ps] - 2*vp.gp[cx+2]    + vp.gp[cx+2   -2*ps];
00885                 dk = vp.gp[cx-2   +2*ps] - 2*vp.gp[cx-2]    + vp.gp[cx-2   -2*ps];
00886                 dl = vp.gp[cx+2*xs+2*ps] - 2*vp.gp[cx+2*xs] + vp.gp[cx+2*xs-2*ps];
00887                 dm = vp.gp[cx-2*xs+2*ps] - 2*vp.gp[cx-2*xs] + vp.gp[cx-2*xs-2*ps];
00888                 pz.gp[cx] = (8*da+4*(db+dc+dd+de)+2*(df+dg+dh+di)+dj+dk+dl+dm)/144.;
00889             }
00890         }
00891     }
00892
00893     cz = ps;
00894     for (y=2; y<ys-2; y++) {
00895         cy = cz + y*xs;
00896         for (x=2; x<xs-2; x++) {
00897             cx = cy + x;
00898             da = vp.gp[cx   +2*ps]   - 2*vp.gp[cx];
00899             db = vp.gp[cx+1 +2*ps]   - 2*vp.gp[cx+1];
00900             dc = vp.gp[cx-1 +2*ps]   - 2*vp.gp[cx-1];
00901             dd = vp.gp[cx+xs+2*ps]   - 2*vp.gp[cx+xs];
00902             de = vp.gp[cx-xs+2*ps]   - 2*vp.gp[cx-xs];
00903             df = vp.gp[cx+1+xs+2*ps] - 2*vp.gp[cx+1+xs];
00904             dg = vp.gp[cx+1-xs+2*ps] - 2*vp.gp[cx+1-xs];
00905             dh = vp.gp[cx-1+xs+2*ps] - 2*vp.gp[cx-1+xs];
00906             di = vp.gp[cx-1-xs+2*ps] - 2*vp.gp[cx-1-xs];
00907             dj = vp.gp[cx+2   +2*ps] - 2*vp.gp[cx+2];
00908             dk = vp.gp[cx-2   +2*ps] - 2*vp.gp[cx-2];
00909             dl = vp.gp[cx+2*xs+2*ps] - 2*vp.gp[cx+2*xs];
00910             dm = vp.gp[cx-2*xs+2*ps] - 2*vp.gp[cx-2*xs];
00911             pz.gp[cx] = (8*da+4*(db+dc+dd+de)+2*(df+dg+dh+di)+dj+dk+dl+dm)/144.;
00912         }
00913     }
00914
00915     cz = (zs-2)*ps;
00916     for (y=2; y<ys-2; y++) {
00917         cy = cz + y*xs;
00918         for (x=2; x<xs-2; x++) {
00919             cx = cy + x;
00920             da = - 2*vp.gp[cx]      + vp.gp[cx   -2*ps];
00921             db = - 2*vp.gp[cx+1]    + vp.gp[cx+1 -2*ps];
00922             dc = - 2*vp.gp[cx-1]    + vp.gp[cx-1 -2*ps];
00923             dd = - 2*vp.gp[cx+xs]   + vp.gp[cx+xs-2*ps];
00924             de = - 2*vp.gp[cx-xs]   + vp.gp[cx-xs-2*ps];
00925             df = - 2*vp.gp[cx+1+xs] + vp.gp[cx+1+xs-2*ps];
00926             dg = - 2*vp.gp[cx+1-xs] + vp.gp[cx+1-xs-2*ps];
00927             dh = - 2*vp.gp[cx-1+xs] + vp.gp[cx-1+xs-2*ps];
00928             di = - 2*vp.gp[cx-1-xs] + vp.gp[cx-1-xs-2*ps];
00929             dj = - 2*vp.gp[cx+2]    + vp.gp[cx+2   -2*ps];
00930             dk = - 2*vp.gp[cx-2]    + vp.gp[cx-2   -2*ps];
00931             dl = - 2*vp.gp[cx+2*xs] + vp.gp[cx+2*xs-2*ps];
00932             dm = - 2*vp.gp[cx-2*xs] + vp.gp[cx-2*xs-2*ps];
00933             pz.gp[cx] = (8*da+4*(db+dc+dd+de)+2*(df+dg+dh+di)+dj+dk+dl+dm)/144.;
00934         }
00935     }
00936
00937     return pz;
00938 }
| FMask gauss_mask | ( | double | sig, | |
| int | ms, | |||
| int | md | |||
| ) |
FMask gauss_mask(double sig, int ms, int md)
ガウシアン処理用のフィルタをつくり出す.
- Parameters:
-
sig ガウス関数のσ. ms フィルタの大きさ. md モード.2: 2次元.その他: 3次元
- Returns:
- ガウシアン用フィルタ
Definition at line 1582 of file gmt.c.
References FMask::imask, Min, FMask::mode, FMask::msize, FMask::nfact, and SINTMAX.
01583 {
01584     int    xx, yy, zz, ns, cp, dx, ps, sw;
01585     double min, *fm;
01586     FMask mask;
01587
01588     mask.mode  = 0;
01589     mask.msize = 0;
01590     mask.imask = NULL;
01591
01592     if (md<=2) {    // 2D
01593         md = 2;
01594         ps = ms*ms;
01595         sw = 0;
01596     }
01597     else {          // 3D
01598         md = 3;
01599         ps = ms*ms*ms;
01600         sw = 1;
01601     }
01602
01603     ns  = ms/2;
01604     min = (double)SINTMAX;
01605     fm = (double*)malloc(ps*sizeof(double));
01606     mask.imask = (int*)malloc(ps*sizeof(int));
01607     if (fm==NULL || mask.imask==NULL) {
01608         free(fm);
01609         free(mask.imask);
01610         memset(&mask, 0, sizeof(FMask));
01611         return mask;
01612     }
01613
01614     for (zz=-ns*sw; zz<=ns*sw; zz++) {
01615         for (yy=-ns; yy<=ns; yy++) {
01616             for (xx=-ns; xx<=ns; xx++) {
01617                 cp = (zz+ns)*ms*ms*sw + (yy+ns)*ms + (xx+ns);
01618                 fm[cp] = exp(-(xx*xx+yy*yy+zz*zz)/(sig*sig));
01619                 if (fm[cp]!=0.0) min = Min(min, fm[cp]);
01620             }
01621         }
01622     }
01623
01624     dx = 0;
01625     for (xx=0; xx<ps; xx++) {
01626         mask.imask[xx] = (int)(fm[xx]/min+0.5);
01627         dx += mask.imask[xx];
01628     }
01629
01630     mask.msize = ms;
01631     mask.nfact = dx;
01632     mask.mode  = md;
01633
01634     free(fm);
01635     return mask;
01636 }
WSGraph imask(WSGraph xp, FMask mask)
フィルタ処理を行なう.
- Parameters:
-
xp 対象となるグラフィックデータ構造体. mask 処理用マスク.
- Returns:
- マスク処理されたグラフィックデータ.
Definition at line 1650 of file gmt.c.
References WSGraph::gp, FMask::imask, JBXL_GRAPH_IVDARG_ERROR, JBXL_GRAPH_NODATA_ERROR, make_WSGraph(), Min, FMask::mode, FMask::msize, FMask::nfact, SINTMAX, WSGraph::state, WSGraph::xs, WSGraph::ys, and WSGraph::zs.
01651 {
01652     int    i, x, y, z, cx;
01653     int    xx, yy, zz, cp, cw, sw;
01654     int    kc, xc, xs, ps, pm, mz, zc;
01655     int    ms, nf, min;
01656     double dd;
01657     WSGraph vp;
01658
01659     memset(&vp, 0, sizeof(WSGraph));
01660     if (xp.gp==NULL) {
01661         vp.state = JBXL_GRAPH_NODATA_ERROR;
01662         return vp;
01663     }
01664
01665     if (xp.zs<=1 && mask.mode>2) {
01666         //fprintf(stderr, "IMASK: mismach mask dimension %d %d\n", xp.zs, mask.mode);
01667         vp.state = JBXL_GRAPH_IVDARG_ERROR;
01668         return vp;
01669     }
01670
01671     nf = mask.nfact;
01672     ms = mask.msize;
01673     if (mask.mode==2) {
01674         sw = 0;
01675         pm = ms*ms;
01676     }
01677     else {
01678         sw = 1;
01679         pm = ms*ms*ms;
01680     }
01681
01682     mz = Min(ms, xp.zs);
01683     kc = pm/2;
01684     zc = mz/2;
01685     xc = ms/2;
01686     xs = xp.xs;
01687     ps = xp.xs*xp.ys;
01688
01689     min = SINTMAX;
01690     for (i=0; i<xp.xs*xp.ys; i++) min = Min(min, xp.gp[i]);
01691     vp = make_WSGraph(xp.xs, xp.ys, 1);
01692     if (vp.gp==NULL) return vp;
01693
01694     for (i=0; i<vp.xs*vp.ys; i++) vp.gp[i] = min;
01695
01696     z = xp.zs/2;
01697     for (y=xc; y<xp.ys-xc; y++)
01698     for (x=xc; x<xp.xs-xc; x++) {
01699         cx = z*ps + y*xs + x;
01700         dd = 0.0;
01701         for (zz=-zc*sw; zz<=zc*sw; zz++)
01702         for (yy=-xc; yy<=xc; yy++)
01703         for (xx=-xc; xx<=xc; xx++) {
01704             cp = kc + xx + yy*ms + zz*ms*ms;
01705             cw = cx + xx + yy*xs + zz*ps;
01706             dd = dd + (double)xp.gp[cw]*mask.imask[cp];
01707         }
01708         vp.gp[y*xs + x] = (sWord)(dd/nf);
01709     }
01710     return vp;
01711 }
WSGraph Laplacian(WSGraph vp, int mode)
2Dグラフィックデータのラプラシアンを計算する.
- Parameters:
-
vp 計算対象となるグラフィックデータ構造体. mode モード. 4: 4近傍ラプラシアン mode 8: 8近傍ラプラシアン mode その他: Sobelのラプラシアン(24近傍)
- Returns:
- 処理されたグラフィックデータ.
Definition at line 26 of file gmt.c.
References WSGraph::gp, JBXL_GRAPH_NODATA_ERROR, make_WSGraph(), Px, WSGraph::state, WSGraph::xs, and WSGraph::ys.
Referenced by edge_enhance().
00027 {
00028     int  i, j;
00029     int  da, db, dc, dd, de, df, dg, dh;
00030     WSGraph lp;
00031
00032     lp = make_WSGraph(vp.xs, vp.ys, 1);
00033     if (lp.gp==NULL) return lp;
00034
00035     if (vp.gp==NULL) {
00036         lp.state = JBXL_GRAPH_NODATA_ERROR;
00037         return lp;
00038     }
00039
00040     if (mode==4) {
00041         for (j=1; j<vp.ys-1; j++) {
00042             for (i=1; i<vp.xs-1; i++) {
00043                 da = Px(vp, i+1, j) + Px(vp, i-1, j);
00044                 db = Px(vp, i, j);
00045                 dc = Px(vp, i, j+1) + Px(vp, i, j-1);
00046                 Px(lp, i, j) = da - 4*db + dc;
00047             }
00048         }
00049     }
00050
00051     else if (mode==8) {
00052         for (j=1; j<vp.ys-1; j++) {
00053             for (i=1; i<vp.xs-1; i++) {
00054                 da = Px(vp, i+1, j) + Px(vp, i-1, j);
00055                 db = Px(vp, i, j+1) + Px(vp, i, j-1);
00056                 dc = Px(vp, i, j);
00057                 dd = Px(vp, i+1, j+1) + Px(vp, i-1, j+1);
00058                 de = Px(vp, i+1, j-1) + Px(vp, i-1, j-1);
00059                 Px(lp, i, j) = da + db - 8*dc + dd + de;
00060             }
00061         }
00062     }
00063
00064     else {
00065         for (j=2; j<vp.ys-2; j++) {
00066             for (i=2; i<vp.xs-2; i++) {
00067                 da = Px(vp, i, j);
00068                 db = Px(vp, i+1, j)   + Px(vp, i-1, j) + Px(vp, i, j+1) + Px(vp, i, j-1);
00069                 dc = Px(vp, i-1, j-2) + Px(vp, i, j-2) + Px(vp, i+1, j-2);
00070                 dd = Px(vp, i-1, j+2) + Px(vp, i, j+2) + Px(vp, i+1, j+2);
00071                 de = Px(vp, i-2, j-1) + Px(vp, i-2, j) + Px(vp, i-2, j+1);
00072                 df = Px(vp, i+2, j-1) + Px(vp, i+2, j) + Px(vp, i+2, j+1);
00073                 dg = Px(vp, i-2, j-2) + Px(vp, i+2, j-2);
00074                 dh = Px(vp, i-2, j+2) + Px(vp, i+2, j+2);
00075                 Px(lp, i, j) = (sWord)((-24*da-8*db+4*(dc+dd+de+df)+2*(dg+dh))/64);
00076             }
00077         }
00078     }
00079
00080     return lp;
00081 }
WSGraph median(WSGraph xp, int ms)
メディアンフィルタ処理を行なう.3D処理可.
- Parameters:
-
xp 対象となるグラフィックデータ構造体. ms フィルタの大きさ.
- Returns:
- メディアンフィルタ処理されたグラフィックデータ.
Definition at line 1725 of file gmt.c.
References WSGraph::gp, JBXL_GRAPH_MEMORY_ERROR, JBXL_GRAPH_NODATA_ERROR, make_WSGraph(), Min, WSGraph::state, WSGraph::xs, WSGraph::ys, and WSGraph::zs.
01726 {
01727     int   i, j, x, y, z;
01728     int   xx, yy, zz, cw, ux, mz;
01729     int   kc, xc, zc, xs, ps, cx;
01730     WSGraph vp;
01731     sWord   *me;
01732
01733     memset(&vp, 0, sizeof(WSGraph));
01734     if (xp.gp==NULL) {
01735         vp.state = JBXL_GRAPH_NODATA_ERROR;
01736         return vp;
01737     }
01738
01739     mz = Min(ms, xp.zs);
01740     me = (sWord*)malloc(ms*ms*mz*sizeof(sWord));
01741     if (me==NULL) {
01742         vp.state = JBXL_GRAPH_MEMORY_ERROR;
01743         return vp;
01744     }
01745
01746     kc = ms*ms*mz/2;
01747     xc = ms/2;
01748     zc = mz/2;
01749     xs = xp.xs;
01750     ps = xp.xs*xp.ys;
01751     vp = make_WSGraph(vp.xs, vp.ys, vp.zs);
01752     if (vp.gp==NULL) {
01753         free(me);
01754         return vp;
01755     }
01756
01757     z = xp.zs/2;
01758     for(y=xc; y<xp.ys-xc; y++) {
01759         for(x=xc; x<xp.xs-xc; x++) {
01760             cx = z*ps + y*xs + x;
01761             i  = 0;
01762             for (zz=-zc; zz<=zc; zz++) {
01763                 for (yy=-xc; yy<=xc; yy++) {
01764                     for (xx=-xc; xx<=xc; xx++) {
01765                         cw = cx + xx + yy*xs + zz*ps;
01766                         me[i++] = xp.gp[cw];
01767                     }
01768                 }
01769             }
01770
01771             for (i=0; i<ms*ms*mz-1; i++) {
01772                 for (j=i+1; j<ms*ms*mz; j++) {
01773                     if (me[i]<me[j]) {
01774                         ux  = me[i];
01775                         me[i] = me[j];
01776                         me[j] = ux;
01777                     }
01778                 }
01779             }
01780             vp.gp[cx-z*ps] = me[kc];
01781         }
01782     }
01783
01784     free(me);
01785     return vp;
01786 }

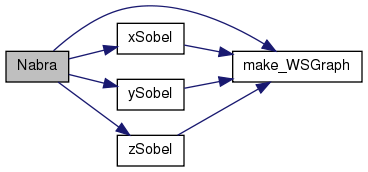
グラフィックデータの ナブラの絶対値を計算する(Sobel).
- Parameters:
-
vp 計算対象となるグラフィックデータ構造体.
- Returns:
- ナブラ.sWord型グラフィックデータ.
Definition at line 1105 of file gmt.c.
References free_WSGraph, WSGraph::gp, JBXL_GRAPH_NODATA_ERROR, make_WSGraph(), WSGraph::state, WSGraph::xs, xSobel(), WSGraph::ys, ySobel(), WSGraph::zs, and zSobel().
01106 {
01107     int   i, xs, ys, zs;
01108     int   xx, yy, zz;
01109     WSGraph px, py, pz, pn;
01110
01111     memset(&pn, 0, sizeof(WSGraph));
01112     if (vp.gp==NULL) {
01113         pn.state = JBXL_GRAPH_NODATA_ERROR;
01114         return pn;
01115     }
01116
01117     xs = vp.xs;
01118     ys = vp.ys;
01119     zs = vp.zs;
01120     pn = make_WSGraph(xs, ys, zs);
01121     if (pn.gp==NULL) return pn;
01122
01123     px = xSobel(vp);
01124     if (px.gp==NULL) {
01125         free_WSGraph(&pn);
01126         pn.state = px.state;
01127         return pn;
01128     }
01129     py = ySobel(vp);
01130     if (py.gp==NULL) {
01131         free_WSGraph(&pn);
01132         free(px.gp);
01133         pn.state = py.state;
01134         return pn;
01135     }
01136
01137     if (vp.zs<3) {
01138         for (i=0; i<xs*ys; i++) {
01139             xx = px.gp[i];
01140             yy = py.gp[i];
01141             pn.gp[i] = (sWord)sqrt(xx*xx + yy*yy);
01142         }
01143     }
01144     else {
01145         pz = zSobel(vp);
01146         if (pz.gp==NULL) {
01147             free_WSGraph(&pn);
01148             free(px.gp);
01149             free(py.gp);
01150             pn.state = pz.state;
01151             return pn;
01152         }
01153
01154         for (i=0; i<xs*ys*zs; i++) {
01155             xx = px.gp[i];
01156             yy = py.gp[i];
01157             zz = pz.gp[i];
01158             pn.gp[i] = (sWord)sqrt(xx*xx + yy*yy + zz*zz);
01159         }
01160         free(pz.gp);
01161     }
01162
01163     free(px.gp);
01164     free(py.gp);
01165
01166     return pn;
01167 }
int out_round(WSGraph vp, int x, int y, IRBound* rb, int mode)
2Dグラフィックデータ構造体vpの(x,y)にあるオブジェクトの周囲長を得る.
- Parameters:
-
vp 操作対象となる 2D グラフィックデータ構造体. x,y 情報を得たいオブジェクトの左上縁の座標. この座標の左横に情報を得たいオブジェクトの一部が在ってはいけない. [out] rb オブジェクトの情報を格納する境界構造体.
rb->xmin: オブジェクトの x座標の最小値.
rb->xmax: オブジェクトの x座標の最大値.
rb->ymin: オブジェクトの y座標の最小値.
rb->ymax: オブジェクトの y座標の最大値.
rb->misc: 8近傍モード時の斜めの距離の回数. 周囲長を 戻り値 + rb->misc*{sqrt(2.)-1} で計算する場合もある.mode モード.8: 8近傍探索.その他: 4近傍探索.
- Returns:
- オブジェクトの周囲長.ただし,8近傍モードの場合,斜めの距離も1と数える.rb->misc 参照.
- Attention:
- 注: 1ドットの長さは1と数える.プログラム中で EGMAX+1 を使用.
Definition at line 2047 of file gmt.c.
References WSGraph::gp, JBXL_GRAPH_IVDARG_ERROR, JBXL_GRAPH_IVDMODE_ERROR, JBXL_GRAPH_IVDPARAM_ERROR, Max, Min, IRBound::misc, OFF, ON, IRBound::xmax, IRBound::xmin, WSGraph::xs, IRBound::ymax, and IRBound::ymin.
02048 {
02049     int  i, j, sp, cp, w, ll, ss;
02050     int  xx, yy, vx, vy, ix, eflg=OFF;
02051     int  r8[8]={-1, 1, -1, -1, 1, -1, 1, 1};
02052     int  r4[8]={ 0, 1, -1,  0, 0, -1, 1, 0};
02053     int* cc;
02054
02055     if (vp.gp==NULL) return JBXL_GRAPH_IVDARG_ERROR;
02056
02057     i = y*vp.xs + x;
02058     rb->xmax = rb->xmin = x;
02059     rb->ymax = rb->ymin = y;
02060     sp = cp = i;
02061     ss = 0;
02062     ll = 0;
02063     vx = 1;
02064     vy = 0;
02065
02066     if (vp.gp[sp]==0 || sp==0) {
02067         //fprintf(stderr,"OUT_ROUND: irregular start point!! sp = %d\n",sp);
02068         return JBXL_GRAPH_IVDPARAM_ERROR;
02069     }
02070
02071     if (mode==8){
02072         ix = 8;
02073         cc = r8;
02074     }
02075     else if (mode==4) {
02076         ix = 4;
02077         cc = r4;
02078     }
02079     else {
02080         //fprintf(stderr,"OUT_ROUND: invalid mode = %d!!\n",mode);
02081         return JBXL_GRAPH_IVDMODE_ERROR;
02082     }
02083
02084     do {
02085         w  = abs(vx)+abs(vy);
02086         xx = (vx*cc[0]+vy*cc[1])/w;
02087         yy = (vx*cc[2]+vy*cc[3])/w;
02088         for (j=1; j<=ix; j++) {
02089             if (vp.gp[cp+yy*vp.xs+xx]!=0) {
02090                 vx = xx;
02091                 vy = yy;
02092                 cp = cp + yy*vp.xs + xx;
02093                 xx = cp%vp.xs;
02094                 yy = (cp-xx)/vp.xs;
02095                 rb->xmax = Max(rb->xmax, xx);
02096                 rb->ymax = Max(rb->ymax, yy);
02097                 rb->xmin = Min(rb->xmin, xx);
02098                 rb->ymin = Min(rb->ymin, yy);
02099                 break;
02100             }
02101             else {
02102                 if(sp==cp && xx==-1 && yy==0) {
02103                     eflg = ON;
02104                     break;
02105                 }
02106                 w  = abs(xx)+abs(yy);
02107                 vx = (xx*cc[4]+yy*cc[5])/w;
02108                 vy = (xx*cc[6]+yy*cc[7])/w;
02109                 xx = vx;
02110                 yy = vy;
02111             }
02112         }
02113         ll++;
02114         if (abs(vx)+abs(vy)==2) ss++;
02115         //
02116     } while(eflg==OFF);
02117
02118     if (mode==4) ss = 0;
02119     (rb->xmax)++;
02120     (rb->ymax)++;
02121     (rb->xmin)--;
02122     (rb->ymin)--;
02123     rb->misc = ss;
02124
02125     return ll;
02126 }
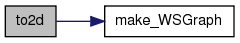
WSGraph to2d(WSGraph gd, int mode)
3Dグラフィックを2Dへ射影する(MIP画像).
- Parameters:
-
gd 操作対象となる3Dグラフィックデータ構造体. mode モード. SIDEX_VIEW: x方向から射影する.
SIDEY_VIEW: y方向から射影する.
SIDEZ_VIEW: z方向から射影する.
TOP_VIEW: z方向から射影する.
TOP_VIEW_DEPTH: z方向から射影する.ただし,z軸に比例して画像に濃淡を付加する.
- Returns:
- 射影された2Dグラフィックデータ(WSGraph, MIP画像)
Definition at line 1805 of file gmt.c.
References WSGraph::gp, JBXL_GRAPH_IVDARG_ERROR, JBXL_GRAPH_NODATA_ERROR, make_WSGraph(), Max, SIDEX_VIEW, SIDEY_VIEW, WSGraph::state, TOP_VIEW, TOP_VIEW_DEPTH, WSGraph::xs, WSGraph::ys, and WSGraph::zs.
01806 {
01807     int  i, j, k, psize;
01808     int  cx, cy, cz, cw, xx, yy;
01809     WSGraph vp;
01810
01811     memset(&vp, 0, sizeof(WSGraph));
01812     if (gd.gp==NULL) {
01813         vp.state = JBXL_GRAPH_NODATA_ERROR;
01814         return vp;
01815     }
01816
01817     psize = gd.xs*gd.ys;
01818
01819     if (mode==TOP_VIEW) {
01820         vp = make_WSGraph(gd.xs, gd.ys, 1);
01821         if (vp.gp==NULL) return vp;
01822
01823         for (k=0; k<gd.zs; k++) {
01824             cz = k*psize;
01825             for (j=0; j<gd.ys; j++) {
01826                 cy = j*gd.xs;
01827                 for (i=0; i<gd.xs; i++) {
01828                     cx = cz + cy + i;
01829                     cw = cy + i;
01830                     if (gd.gp[cx]!=0) vp.gp[cw] = Max(vp.gp[cw], gd.gp[cx]);
01831                 }
01832             }
01833         }
01834     }
01835
01836     else if (mode==TOP_VIEW_DEPTH) {
01837         vp = make_WSGraph(gd.xs, gd.ys, 1);
01838         if (vp.gp==NULL) return vp;
01839
01840         for (k=0; k<gd.zs; k++) {
01841             cz = k*psize;
01842             for (j=0; j<gd.ys; j++) {
01843                 cy = j*gd.xs;
01844                 for (i=0; i<gd.xs; i++) {
01845                     cx = cz + cy + i;
01846                     cw = cy + i;
01847                     if (gd.gp[cx]!=0) vp.gp[cw] = Max(vp.gp[cw], (gd.zs-k)+100);
01848                 }
01849             }
01850         }
01851     }
01852
01853     else if (mode==SIDEX_VIEW) {
01854         vp = make_WSGraph(gd.ys, gd.zs, 1);
01855         if (vp.gp==NULL) return vp;
01856
01857         for (k=0; k<gd.zs; k++) {
01858             cz = k*psize;
01859             yy = k;
01860             for (j=0; j<gd.ys; j++) {
01861                 cy = j*gd.xs;
01862                 xx = gd.ys - 1 - j;
01863                 for (i=0; i<gd.xs; i++) {
01864                     cx = cz + cy + i;
01865                     cw = yy*vp.xs + xx;
01866                     if (gd.gp[cx]!=0) vp.gp[cw] = Max(vp.gp[cw], gd.gp[cx]);
01867                 }
01868             }
01869         }
01870     }
01871
01872     else if (mode==SIDEY_VIEW) {
01873         vp = make_WSGraph(gd.xs, gd.zs, 1);
01874         if (vp.gp==NULL) return vp;
01875
01876         for (k=0; k<gd.zs; k++) {
01877             cz = k*psize;
01878             yy = k;
01879             for (j=0; j<gd.ys; j++) {
01880                 cy = j*gd.xs;
01881                 for (i=0; i<gd.xs; i++) {
01882                     cx = cz + cy + i;
01883                     xx = i;
01884                     cw = yy*vp.xs + xx;
01885                     if (gd.gp[cx]!=0) vp.gp[cw] = Max(vp.gp[cw], gd.gp[cx]);
01886                 }
01887             }
01888         }
01889     }
01890
01891     else {
01892         memset(&vp, 0, sizeof(WSGraph));
01893         vp.state = JBXL_GRAPH_IVDARG_ERROR;
01894         //fprintf(stderr,"TO2D: unknown mode = %d.\n",mode);
01895     }
01896
01897     return vp;
01898 }
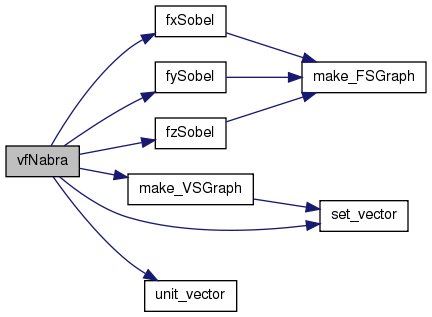
グラフィックデータの ナブラを実数計算する(Sobel). 精度が上昇するが時間がかかる.
- Parameters:
-
vp 計算対象となるグラフィックデータ構造体.
- Returns:
- ナブラ.ベクトル型グラフィックデータ.
Definition at line 1028 of file gmt.c.
References free_VSGraph, fxSobel(), fySobel(), fzSobel(), VSGraph::gp, FSGraph::gp, JBXL_GRAPH_NODATA_ERROR, make_VSGraph(), set_vector(), FSGraph::state, VSGraph::state, unit_vector(), FSGraph::xs, FSGraph::ys, and FSGraph::zs.
01029 {
01030     int    i, xs, ys, zs;
01031     double xx, yy, zz;
01032     FSGraph px, py, pz;
01033     VSGraph pn;
01034
01035     memset(&pn, 0, sizeof(VSGraph));
01036     if (vp.gp==NULL) {
01037         pn.state = JBXL_GRAPH_NODATA_ERROR;
01038         return pn;
01039     }
01040
01041     xs = vp.xs;
01042     ys = vp.ys;
01043     zs = vp.zs;
01044     pn = make_VSGraph(xs, ys, zs);
01045     if (pn.gp==NULL) return pn;
01046
01047     px = fxSobel(vp);
01048     if (px.gp==NULL) {
01049         free_VSGraph(&pn);
01050         pn.state = px.state;
01051         return pn;
01052     }
01053     py = fySobel(vp);
01054     if (py.gp==NULL) {
01055         free_VSGraph(&pn);
01056         free(px.gp);
01057         pn.state = py.state;
01058         return pn;
01059     }
01060
01061     if (vp.zs<3) {
01062         for (i=0; i<xs*ys; i++) {
01063             xx = px.gp[i];
01064             yy = py.gp[i];
01065             pn.gp[i] = set_vector(xx, yy, 0.0);
01066             unit_vector(pn.gp[i]);
01067         }
01068     }
01069     else {
01070         pz = fzSobel(vp);
01071         if (pz.gp==NULL) {
01072             free_VSGraph(&pn);
01073             free(px.gp);
01074             free(py.gp);
01075             pn.state = pz.state;
01076             return pn;
01077         }
01078
01079         for (i=0; i<xs*ys*zs; i++) {
01080             xx = px.gp[i];
01081             yy = py.gp[i];
01082             zz = pz.gp[i];
01083             pn.gp[i] = set_vector(xx, yy, zz);
01084             unit_vector(pn.gp[i]);
01085         }
01086         free(pz.gp);
01087     }
01088
01089     free(px.gp);
01090     free(py.gp);
01091
01092     return pn;
01093 }
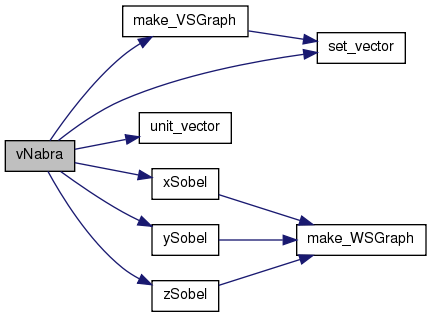
グラフィックデータの ナブラを計算する(Sobel).
- Parameters:
-
vp 計算対象となるグラフィックデータ構造体.
- Returns:
- ナブラ.ベクトル型グラフィックデータ.
Definition at line 950 of file gmt.c.
References free_VSGraph, VSGraph::gp, WSGraph::gp, JBXL_GRAPH_NODATA_ERROR, make_VSGraph(), set_vector(), WSGraph::state, VSGraph::state, unit_vector(), WSGraph::xs, xSobel(), WSGraph::ys, ySobel(), WSGraph::zs, and zSobel().
00951 {
00952     int   i, xs, ys, zs;
00953     double  xx, yy, zz;
00954     WSGraph px, py, pz;
00955     VSGraph pn;
00956
00957     memset(&pn, 0, sizeof(VSGraph));
00958     if (vp.gp==NULL) {
00959         pn.state = JBXL_GRAPH_NODATA_ERROR;
00960         return pn;
00961     }
00962
00963     xs = vp.xs;
00964     ys = vp.ys;
00965     zs = vp.zs;
00966     pn = make_VSGraph(xs, ys, zs);
00967     if (pn.gp==NULL) return pn;
00968
00969     px = xSobel(vp);
00970     if (px.gp==NULL) {
00971         free_VSGraph(&pn);
00972         pn.state = px.state;
00973         return pn;
00974     }
00975     py = ySobel(vp);
00976     if (py.gp==NULL) {
00977         free_VSGraph(&pn);
00978         free(px.gp);
00979         pn.state = py.state;
00980         return pn;
00981     }
00982
00983     if (vp.zs<3) {
00984         for (i=0; i<xs*ys; i++) {
00985             xx = px.gp[i];
00986             yy = py.gp[i];
00987             pn.gp[i] = set_vector(xx, yy, 0.0);
00988             unit_vector(pn.gp[i]);
00989         }
00990     }
00991     else {
00992         pz = zSobel(vp);
00993         if (pz.gp==NULL) {
00994             free_VSGraph(&pn);
00995             free(px.gp);
00996             free(py.gp);
00997             pn.state = pz.state;
00998             return pn;
00999         }
01000
01001         for (i=0; i<xs*ys*zs; i++) {
01002             xx = px.gp[i];
01003             yy = py.gp[i];
01004             zz = pz.gp[i];
01005             pn.gp[i] = set_vector(xx, yy, zz);
01006             unit_vector(pn.gp[i]);
01007         }
01008         free(pz.gp);
01009     }
01010
01011     free(px.gp);
01012     free(py.gp);
01013
01014     return pn;
01015 }
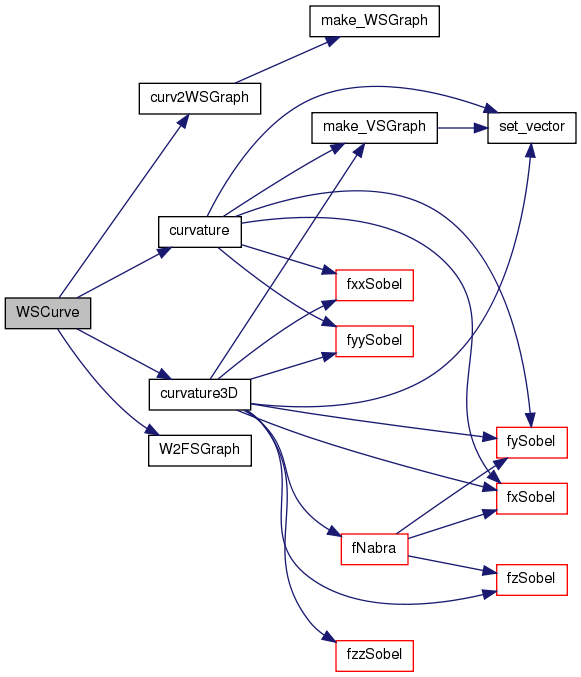
WSGraph WSCurve(WSGraph gx, int mode, int cc)
曲面の形状をグラフィックデータ(輝度値)に変換する.
- Parameters:
-
gx 操作対象となる曲面形状情報3の入ったグラフィックデータ. mode 輝度値に変換する曲面の形状.指定できる形状は ALL, FLAT, PIT, SADDLE_RIDGE, SADDLE_VALLEY, NONE_SHAPE, MINIMAL, RIDGE, VALLEY, PEAK.
ALLを指定した場合,形状は違った輝度値に変換される.cc modeに ALLを指定しなかった場合,指定された曲面をこの輝度値に変換する.
- Returns:
- 曲面の形状情報を代入した sWord型グラフィックデータ.
- Note:
- FLAT=500, PIT=1000, SADDLE_RIDGE=1500, SADDLE_VALLEY=2000, NONE_SHAPE=2500, MINIMAL=3000, RIDGE=3500, VALLEY=4000, PEAK=4500
Definition at line 1484 of file gmt.c.
References ALL, curv2WSGraph(), curvature(), curvature3D(), FLAT, freeNull, VSGraph::gp, FSGraph::gp, WSGraph::gp, JBXL_GRAPH_NODATA_ERROR, MINIMAL, NONE_SHAPE, PEAK, PIT, RIDGE, SADDLE_RIDGE, SADDLE_VALLEY, WSGraph::state, VALLEY, W2FSGraph(), WSGraph::xs, WSGraph::ys, and WSGraph::zs.
01485 {
01486     int  i;
01487     FSGraph wp;
01488     VSGraph xp;
01489     WSGraph vp;
01490
01491     memset(&vp, 0, sizeof(WSGraph));
01492     if (gx.gp==NULL) {
01493         vp.state = JBXL_GRAPH_NODATA_ERROR;
01494         return vp;
01495     }
01496
01497     wp = W2FSGraph(gx);
01498     if (gx.zs<5) xp = curvature(wp);
01499     else         xp = curvature3D(wp);
01500
01501     vp = curv2WSGraph(xp);
01502     freeNull(wp.gp);
01503     freeNull(xp.gp);
01504     if (vp.gp==NULL) return vp;
01505
01506     if (mode==ALL) {
01507         for (i=0; i<vp.xs*vp.ys*vp.zs; i++) {
01508             if    (vp.gp[i]==FLAT)            vp.gp[i] = 500;
01509             else if (vp.gp[i]==PIT)           vp.gp[i] = 1000;
01510             else if (vp.gp[i]==SADDLE_RIDGE)  vp.gp[i] = 1500;
01511             else if (vp.gp[i]==SADDLE_VALLEY) vp.gp[i] = 2000;
01512             else if (vp.gp[i]==NONE_SHAPE)    vp.gp[i] = 2500;
01513             else if (vp.gp[i]==MINIMAL)       vp.gp[i] = 3000;
01514             else if (vp.gp[i]==RIDGE)         vp.gp[i] = 3500;
01515             else if (vp.gp[i]==VALLEY)        vp.gp[i] = 4000;
01516             else if (vp.gp[i]==PEAK)          vp.gp[i] = 4500;
01517             else                              vp.gp[i] = 0;
01518         }
01519     }
01520     else {
01521         for (i=0; i<vp.xs*vp.ys*vp.zs; i++) {
01522             if ((vp.gp[i]&mode)!=0) vp.gp[i] = cc;
01523             else                    vp.gp[i] = 0;
01524         }
01525     }
01526     return vp;
01527 }
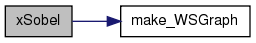
グラフィックデータの x方向微分(Sobel)を計算する.
- Parameters:
-
vp 計算対象となるグラフィックデータ構造体.
- Returns:
- 処理されたグラフィックデータ.
Definition at line 93 of file gmt.c.
References WSGraph::gp, JBXL_GRAPH_NODATA_ERROR, JBXL_NORMAL, make_WSGraph(), WSGraph::state, Vx, WSGraph::xs, WSGraph::ys, and WSGraph::zs.
Referenced by Nabra(), and vNabra().
00094 {
00095     int  i, j, k;
00096     int  da, db, dc, dd, de, nr;
00097     WSGraph xp;
00098
00099     memset(&xp, 0, sizeof(WSGraph));
00100     if (vp.gp==NULL) {
00101         xp.state = JBXL_GRAPH_NODATA_ERROR;
00102         return xp;
00103     }
00104     xp.state = JBXL_NORMAL;
00105
00106     if (vp.zs<=0) vp.zs = 1;
00107     xp = make_WSGraph(vp.xs, vp.ys, vp.zs);
00108     if (xp.gp==NULL) return xp;
00109
00110     for (k=0; k<vp.zs; k++) {
00111         for (j=1; j<vp.ys-1; j++) {
00112             for (i=1; i<vp.xs-1; i++) {
00113                 da = Vx(vp, i+1, j-1, k) - Vx(vp, i-1, j-1, k);
00114                 db = Vx(vp, i+1, j,   k) - Vx(vp, i-1, j,   k);
00115                 dc = Vx(vp, i+1, j+1, k) - Vx(vp, i-1, j+1, k);
00116                 if (k==0 || k==vp.zs-1) {
00117                     dd = de = 0;
00118                     nr = 8;
00119                 }
00120                 else {
00121                     dd = Vx(vp, i+1, j, k-1) - Vx(vp, i-1, j, k-1);
00122                     de = Vx(vp, i+1, j, k+1) - Vx(vp, i-1, j, k+1);
00123                     nr = 12;
00124                 }
00125                 Vx(xp, i, j, k) = (sWord)((da + 2*db + dc + dd + de)/nr);
00126             }
00127         }
00128     }
00129
00130     return xp;
00131 }

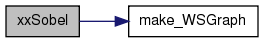
グラフィックデータの x方向の2階微分(Sobel)を計算する.
- Parameters:
-
vp 計算対象となるグラフィックデータ構造体.
- Returns:
- 処理されたグラフィックデータ.
Definition at line 423 of file gmt.c.
References WSGraph::gp, JBXL_GRAPH_NODATA_ERROR, make_WSGraph(), WSGraph::state, WSGraph::xs, WSGraph::ys, and WSGraph::zs.
00424 {
00425     int  x, y, z, xs, ys, zs, cx, cy, cz, ps;
00426     int  da, db, dc, dd, de;
00427     int  df, dg, dh, di, dj, dk, dl, dm;
00428     WSGraph px;
00429
00430     memset(&px, 0, sizeof(WSGraph));
00431     if (vp.gp==NULL) {
00432         px.state = JBXL_GRAPH_NODATA_ERROR;
00433         return px;
00434     }
00435
00436     xs = vp.xs;
00437     ys = vp.ys;
00438     zs = vp.zs;
00439     ps = xs*ys;
00440
00441     if (zs<5) {
00442         px = make_WSGraph(xs, ys, 1);
00443         if (px.gp==NULL) return px;
00444
00445         for (y=2; y<ys-2; y++) {
00446             cy = y*xs;
00447             for (x=2; x<xs-2; x++) {
00448                 cx = cy + x;
00449                 da = vp.gp[cx-2*xs+2] - 2*vp.gp[cx-2*xs] + vp.gp[cx-2*xs-2];
00450                 db = vp.gp[cx  -xs+2] - 2*vp.gp[cx  -xs] + vp.gp[cx  -xs-2];
00451                 dc = vp.gp[cx     +2] - 2*vp.gp[cx]      + vp.gp[cx     -2];
00452                 dd = vp.gp[cx  +xs+2] - 2*vp.gp[cx  +xs] + vp.gp[cx  +xs-2];
00453                 de = vp.gp[cx+2*xs+2] - 2*vp.gp[cx+2*xs] + vp.gp[cx+2*xs-2];
00454                 px.gp[cx] = (sWord)((da + 4*db + 6*dc + 4*dd + de)/64);
00455             }
00456         }
00457     }
00458
00459     else {
00460         px = make_WSGraph(xs, ys, zs);
00461         if (px.gp==NULL) return px;
00462
00463         for (z=2; z<zs-2; z++) {
00464             cz = z*ps;
00465             for (y=2; y<ys-2; y++) {
00466                 cy = cz + y*xs;
00467                 for (x=2; x<xs-2; x++) {
00468                     cx = cy + x;
00469                     da = vp.gp[cx   +2]    - 2*vp.gp[cx]       + vp.gp[cx-2];
00470                     db = vp.gp[cx+xs+2]    - 2*vp.gp[cx+xs]    + vp.gp[cx+xs-2];
00471                     dc = vp.gp[cx-xs+2]    - 2*vp.gp[cx-xs]    + vp.gp[cx-xs-2];
00472                     dd = vp.gp[cx+ps+2]    - 2*vp.gp[cx+ps]    + vp.gp[cx+ps-2];
00473                     de = vp.gp[cx-ps+2]    - 2*vp.gp[cx-ps]    + vp.gp[cx-ps-2];
00474                     df = vp.gp[cx+xs+ps+2] - 2*vp.gp[cx+xs+ps] + vp.gp[cx+xs+ps-2];
00475                     dg = vp.gp[cx+xs-ps+2] - 2*vp.gp[cx+xs-ps] + vp.gp[cx+xs-ps-2];
00476                     dh = vp.gp[cx-xs+ps+2] - 2*vp.gp[cx-xs+ps] + vp.gp[cx-xs+ps-2];
00477                     di = vp.gp[cx-xs-ps+2] - 2*vp.gp[cx-xs-ps] + vp.gp[cx-xs-ps-2];
00478                     dj = vp.gp[cx+2*xs+2]  - 2*vp.gp[cx+2*xs]  + vp.gp[cx+2*xs-2];
00479                     dk = vp.gp[cx-2*xs+2]  - 2*vp.gp[cx-2*xs]  + vp.gp[cx-2*xs-2];
00480                     dl = vp.gp[cx+2*ps+2]  - 2*vp.gp[cx+2*ps]  + vp.gp[cx+2*ps-2];
00481                     dm = vp.gp[cx-2*ps+2]  - 2*vp.gp[cx-2*ps]  + vp.gp[cx-2*ps-2];
00482                     px.gp[cx] = (sWord)((8*da+4*(db+dc+dd+de)+2*(df+dg+dh+di)+dj+dk+dl+dm)/144);
00483                 }
00484             }
00485         }
00486     }
00487
00488     return px;
00489 }
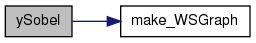
グラフィックデータの y方向微分(Sobel)を計算する.
- Parameters:
-
vp 計算対象となるグラフィックデータ構造体.
- Returns:
- 処理されたグラフィックデータ.
Definition at line 193 of file gmt.c.
References WSGraph::gp, JBXL_GRAPH_NODATA_ERROR, make_WSGraph(), WSGraph::state, Vx, WSGraph::xs, WSGraph::ys, and WSGraph::zs.
Referenced by Nabra(), and vNabra().
00194 {
00195     int  i, j, k;
00196     int  da, db, dc, dd, de, nr;
00197     WSGraph xp;
00198
00199     memset(&xp, 0, sizeof(WSGraph));
00200     if (vp.gp==NULL) {
00201         xp.state = JBXL_GRAPH_NODATA_ERROR;
00202         return xp;
00203     }
00204
00205     if (vp.zs<=0) vp.zs = 1;
00206     xp = make_WSGraph(vp.xs, vp.ys, vp.zs);
00207     if (xp.gp==NULL) return xp;
00208
00209     for (k=0; k<vp.zs; k++) {
00210         for (j=1; j<vp.ys-1; j++) {
00211             for (i=1; i<vp.xs-1; i++) {
00212                 da = Vx(vp, i-1, j+1, k) - Vx(vp, i-1, j-1, k);
00213                 db = Vx(vp, i,   j+1, k) - Vx(vp, i,   j-1, k);
00214                 dc = Vx(vp, i+1, j+1, k) - Vx(vp, i+1, j-1, k);
00215                 if (k==0 || k==vp.zs-1) {
00216                     dd = de = 0;
00217                     nr = 8;
00218                 }
00219                 else {
00220                     dd = Vx(vp, i, j+1, k-1) - Vx(vp, i, j-1, k-1);
00221                     de = Vx(vp, i, j+1, k+1) - Vx(vp, i, j-1, k+1);
00222                     nr = 12;
00223                 }
00224                 Vx(xp, i, j, k) = (sWord)((da + 2*db + dc + dd + de)/nr);
00225             }
00226         }
00227     }
00228
00229     return xp;
00230 }

グラフィックデータの y方向の2階微分(Sobel)を計算する.
- Parameters:
-
vp 計算対象となるグラフィックデータ構造体.
- Returns:
- 処理されたグラフィックデータ.
Definition at line 580 of file gmt.c.
References WSGraph::gp, JBXL_GRAPH_NODATA_ERROR, make_WSGraph(), WSGraph::state, WSGraph::xs, WSGraph::ys, and WSGraph::zs.
00581 {
00582     int  x, y, z, xs, ys, zs, cx, cy, cz, ps;
00583     int  da, db, dc, dd, de;
00584     int  df, dg, dh, di, dj, dk, dl, dm;
00585     WSGraph py;
00586
00587     memset(&py, 0, sizeof(WSGraph));
00588     if (vp.gp==NULL) {
00589         py.state = JBXL_GRAPH_NODATA_ERROR;
00590         return py;
00591     }
00592
00593     xs = vp.xs;
00594     ys = vp.ys;
00595     zs = vp.zs;
00596     ps = xs*ys;
00597
00598     if (zs<5) {
00599         py = make_WSGraph(xs, ys, 1);
00600         if (py.gp==NULL) return py;
00601
00602         for (y=2; y<ys-2; y++) {
00603             cy = y*xs;
00604             for (x=2; x<xs-2; x++) {
00605                 cx = cy + x;
00606                 da = vp.gp[cx+2*xs-2] - 2*vp.gp[cx-2] + vp.gp[cx-2*xs-2];
00607                 db = vp.gp[cx+2*xs-1] - 2*vp.gp[cx-1] + vp.gp[cx-2*xs-1];
00608                 dc = vp.gp[cx+2*xs]   - 2*vp.gp[cx]   + vp.gp[cx-2*xs];
00609                 dd = vp.gp[cx+2*xs+1] - 2*vp.gp[cx+1] + vp.gp[cx-2*xs+1];
00610                 de = vp.gp[cx+2*xs+2] - 2*vp.gp[cx+2] + vp.gp[cx-2*xs+2];
00611                 py.gp[cx] = (sWord)((da + 4*db + 6*dc + 4*dd + de)/64);
00612             }
00613         }
00614     }
00615     else {
00616         py = make_WSGraph(xs, ys, zs);
00617         if (py.gp==NULL) return py;
00618
00619         for (z=2; z<zs-2; z++) {
00620             cz = z*ps;
00621             for (y=2; y<ys-2; y++) {
00622                 cy = cz + y*xs;
00623                 for (x=2; x<xs-2; x++) {
00624                     cx = cy + x;
00625                     da = vp.gp[cx+2*xs]      - 2*vp.gp[cx]      + vp.gp[cx-2*xs];
00626                     db = vp.gp[cx+1+2*xs]    - 2*vp.gp[cx+1]    + vp.gp[cx+1-2*xs];
00627                     dc = vp.gp[cx-1+2*xs]    - 2*vp.gp[cx-1]    + vp.gp[cx-1-2*xs];
00628                     dd = vp.gp[cx+ps+2*xs]   - 2*vp.gp[cx+ps]   + vp.gp[cx+ps-2*xs];
00629                     de = vp.gp[cx-ps+2*xs]   - 2*vp.gp[cx-ps]   + vp.gp[cx-ps-2*xs];
00630                     df = vp.gp[cx+1+ps+2*xs] - 2*vp.gp[cx+1+ps] + vp.gp[cx+1+ps-2*xs];
00631                     dg = vp.gp[cx+1-ps+2*xs] - 2*vp.gp[cx+1-ps] + vp.gp[cx+1-ps-2*xs];
00632                     dh = vp.gp[cx-1+ps+2*xs] - 2*vp.gp[cx-1+ps] + vp.gp[cx-1+ps-2*xs];
00633                     di = vp.gp[cx-1-ps+2*xs] - 2*vp.gp[cx-1-ps] + vp.gp[cx-1-ps-2*xs];
00634                     dj = vp.gp[cx+2+2*xs]    - 2*vp.gp[cx+2]    + vp.gp[cx+2-2*xs];
00635                     dk = vp.gp[cx-2+2*xs]    - 2*vp.gp[cx-2]    + vp.gp[cx-2-2*xs];
00636                     dl = vp.gp[cx+2*ps+2*xs] - 2*vp.gp[cx+2*ps] + vp.gp[cx+2*ps-2*xs];
00637                     dm = vp.gp[cx-2*ps+2*xs] - 2*vp.gp[cx-2*ps] + vp.gp[cx-2*ps-2*xs];
00638                     py.gp[cx] = (sWord)((8*da+4*(db+dc+dd+de)+2*(df+dg+dh+di)+dj+dk+dl+dm)/144);
00639                 }
00640             }
00641         }
00642     }
00643
00644     return py;
00645 }
グラフィックデータの z方向微分(Sobel)を計算する.
- Parameters:
-
vp 計算対象となるグラフィックデータ構造体.
- Returns:
- 処理されたグラフィックデータ.
Definition at line 292 of file gmt.c.
References WSGraph::gp, JBXL_GRAPH_IVDARG_ERROR, JBXL_GRAPH_NODATA_ERROR, make_WSGraph(), WSGraph::state, Vx, WSGraph::xs, WSGraph::ys, and WSGraph::zs.
Referenced by Nabra(), and vNabra().
00293 {
00294     int  i, j, k;
00295     int  da, db, dc, dd, de;
00296     WSGraph xp;
00297
00298     memset(&xp, 0, sizeof(WSGraph));
00299     if (vp.gp==NULL) {
00300         xp.state = JBXL_GRAPH_NODATA_ERROR;
00301         return xp;
00302     }
00303
00304     if (vp.zs<=1) {
00305         //fprintf(stderr,"ZSOBEL: no 3D data inputed.\n");
00306         xp.state = JBXL_GRAPH_IVDARG_ERROR;
00307         return xp;
00308     }
00309
00310     xp = make_WSGraph(vp.xs, vp.ys, vp.zs);
00311     if (xp.gp==NULL) return xp;
00312
00313     for (k=1; k<vp.zs-1; k++) {
00314         for (j=1; j<vp.ys-1; j++) {
00315             for (i=1; i<vp.xs-1; i++) {
00316                 da = Vx(vp, i-1, j, k+1) - Vx(vp, i-1, j, k-1);
00317                 db = Vx(vp, i+1, j, k+1) - Vx(vp, i+1, j, k-1);
00318                 dc = Vx(vp, i,   j, k+1) - Vx(vp, i,   j, k-1);
00319                 dd = Vx(vp, i, j-1, k+1) - Vx(vp, i, j-1, k-1);
00320                 de = Vx(vp, i, j+1, k+1) - Vx(vp, i, j+1, k-1);
00321                 Vx(xp, i, j, k) = (sWord)((da + db + 2*dc + dd + de)/12);
00322             }
00323         }
00324     }
00325
00326     for (j=1; j<vp.ys-1; j++) {
00327         for (i=1; i<vp.xs-1; i++) {
00328             da = Vx(vp, i-1, j, 1) - Vx(vp, i-1, j, 0);
00329             db = Vx(vp, i+1, j, 1) - Vx(vp, i+1, j, 0);
00330             dc = Vx(vp, i,   j, 1) - Vx(vp, i,   j, 0);
00331             dd = Vx(vp, i, j-1, 1) - Vx(vp, i, j-1, 0);
00332             de = Vx(vp, i, j+1, 1) - Vx(vp, i, j+1, 0);
00333             Vx(xp, i, j, 0) = (sWord)((da + db + 2*dc + dd + de)/12);
00334
00335             da = Vx(vp, i-1, j, vp.zs-1) - Vx(vp, i-1, j, vp.zs-2);
00336             db = Vx(vp, i+1, j, vp.zs-1) - Vx(vp, i+1, j, vp.zs-2);
00337             dc = Vx(vp, i,   j, vp.zs-1) - Vx(vp, i,   j, vp.zs-2);
00338             dd = Vx(vp, i, j-1, vp.zs-1) - Vx(vp, i, j-1, vp.zs-2);
00339             de = Vx(vp, i, j+1, vp.zs-1) - Vx(vp, i, j+1, vp.zs-2);
00340             Vx(xp, i, j, vp.zs-1) = (sWord)((da + db + 2*dc + dd + de)/12);
00341         }
00342     }
00343
00344     return xp;
00345 }
グラフィックデータの z方向の2階微分(Sobel)を計算する.
- Parameters:
-
vp 計算対象となるグラフィックデータ構造体.
- Returns:
- 処理されたグラフィックデータ.
Definition at line 735 of file gmt.c.
References WSGraph::gp, JBXL_GRAPH_IVDARG_ERROR, JBXL_GRAPH_NODATA_ERROR, make_WSGraph(), WSGraph::state, WSGraph::xs, WSGraph::ys, and WSGraph::zs.
00736 {
00737     int  x, y, z, xs, ys, zs, cx, cy, cz, ps;
00738     int  da, db, dc, dd, de;
00739     int  df, dg, dh, di, dj, dk, dl, dm;
00740     WSGraph pz;
00741
00742     memset(&pz, 0, sizeof(WSGraph));
00743     if (vp.gp==NULL) {
00744         pz.state = JBXL_GRAPH_NODATA_ERROR;
00745         return pz;
00746     }
00747
00748     if (vp.zs<5) {
00749         //fprintf(stderr,"ZZSOBEL: no 3D data inputed.\n");
00750         pz.state = JBXL_GRAPH_IVDARG_ERROR;
00751         return pz;
00752     }
00753
00754     xs = vp.xs;
00755     ys = vp.ys;
00756     zs = vp.zs;
00757     ps = xs*ys;
00758     pz = make_WSGraph(xs, ys, zs);
00759     if (pz.gp==NULL) return pz;
00760
00761     for (z=2; z<zs-2; z++) {
00762         cz = z*ps;
00763         for (y=2; y<ys-2; y++) {
00764             cy = cz + y*xs;
00765             for (x=2; x<xs-2; x++) {
00766                 cx = cy + x;
00767                 da = vp.gp[cx   +2*ps]   - 2*vp.gp[cx]       + vp.gp[cx   -2*ps];
00768                 db = vp.gp[cx+1 +2*ps]   - 2*vp.gp[cx+1]     + vp.gp[cx+1 -2*ps];
00769                 dc = vp.gp[cx-1 +2*ps]   - 2*vp.gp[cx-1]     + vp.gp[cx-1 -2*ps];
00770                 dd = vp.gp[cx+xs+2*ps]   - 2*vp.gp[cx+xs]    + vp.gp[cx+xs-2*ps];
00771                 de = vp.gp[cx-xs+2*ps]   - 2*vp.gp[cx-xs]    + vp.gp[cx-xs-2*ps];
00772                 df = vp.gp[cx+1+xs+2*ps] - 2*vp.gp[cx+1+xs]  + vp.gp[cx+1+xs-2*ps];
00773                 dg = vp.gp[cx+1-xs+2*ps] - 2*vp.gp[cx+1-xs]  + vp.gp[cx+1-xs-2*ps];
00774                 dh = vp.gp[cx-1+xs+2*ps] - 2*vp.gp[cx-1+xs]  + vp.gp[cx-1+xs-2*ps];
00775                 di = vp.gp[cx-1-xs+2*ps] - 2*vp.gp[cx-1-xs]  + vp.gp[cx-1-xs-2*ps];
00776                 dj = vp.gp[cx+2   +2*ps] - 2*vp.gp[cx+2]     + vp.gp[cx+2   -2*ps];
00777                 dk = vp.gp[cx-2   +2*ps] - 2*vp.gp[cx-2]     + vp.gp[cx-2   -2*ps];
00778                 dl = vp.gp[cx+2*xs+2*ps] - 2*vp.gp[cx+2*xs]  + vp.gp[cx+2*xs-2*ps];
00779                 dm = vp.gp[cx-2*xs+2*ps] - 2*vp.gp[cx-2*xs]  + vp.gp[cx-2*xs-2*ps];
00780                 pz.gp[cx] = (sWord)((8*da+4*(db+dc+dd+de)+2*(df+dg+dh+di)+dj+dk+dl+dm)/144);
00781             }
00782         }
00783     }
00784
00785     cz = ps;
00786     for (y=2; y<ys-2; y++) {
00787         cy = cz + y*xs;
00788         for (x=2; x<xs-2; x++) {
00789             cx = cy + x;
00790             da = vp.gp[cx   +2*ps]   - 2*vp.gp[cx];
00791             db = vp.gp[cx+1 +2*ps]   - 2*vp.gp[cx+1];
00792             dc = vp.gp[cx-1 +2*ps]   - 2*vp.gp[cx-1];
00793             dd = vp.gp[cx+xs+2*ps]   - 2*vp.gp[cx+xs];
00794             de = vp.gp[cx-xs+2*ps]   - 2*vp.gp[cx-xs];
00795             df = vp.gp[cx+1+xs+2*ps] - 2*vp.gp[cx+1+xs];
00796             dg = vp.gp[cx+1-xs+2*ps] - 2*vp.gp[cx+1-xs];
00797             dh = vp.gp[cx-1+xs+2*ps] - 2*vp.gp[cx-1+xs];
00798             di = vp.gp[cx-1-xs+2*ps] - 2*vp.gp[cx-1-xs];
00799             dj = vp.gp[cx+2   +2*ps] - 2*vp.gp[cx+2];
00800             dk = vp.gp[cx-2   +2*ps] - 2*vp.gp[cx-2];
00801             dl = vp.gp[cx+2*xs+2*ps] - 2*vp.gp[cx+2*xs];
00802             dm = vp.gp[cx-2*xs+2*ps] - 2*vp.gp[cx-2*xs];
00803             pz.gp[cx] = (sWord)((8*da+4*(db+dc+dd+de)+2*(df+dg+dh+di)+dj+dk+dl+dm)/144);
00804         }
00805     }
00806
00807     cz = (zs-2)*ps;
00808     for (y=2; y<ys-2; y++) {
00809         cy = cz + y*xs;
00810         for (x=2; x<xs-2; x++) {
00811             cx = cy + x;
00812             da = - 2*vp.gp[cx]      + vp.gp[cx   -2*ps];
00813             db = - 2*vp.gp[cx+1]    + vp.gp[cx+1 -2*ps];
00814             dc = - 2*vp.gp[cx-1]    + vp.gp[cx-1 -2*ps];
00815             dd = - 2*vp.gp[cx+xs]   + vp.gp[cx+xs-2*ps];
00816             de = - 2*vp.gp[cx-xs]   + vp.gp[cx-xs-2*ps];
00817             df = - 2*vp.gp[cx+1+xs] + vp.gp[cx+1+xs-2*ps];
00818             dg = - 2*vp.gp[cx+1-xs] + vp.gp[cx+1-xs-2*ps];
00819             dh = - 2*vp.gp[cx-1+xs] + vp.gp[cx-1+xs-2*ps];
00820             di = - 2*vp.gp[cx-1-xs] + vp.gp[cx-1-xs-2*ps];
00821             dj = - 2*vp.gp[cx+2]    + vp.gp[cx+2   -2*ps];
00822             dk = - 2*vp.gp[cx-2]    + vp.gp[cx-2   -2*ps];
00823             dl = - 2*vp.gp[cx+2*xs] + vp.gp[cx+2*xs-2*ps];
00824             dm = - 2*vp.gp[cx-2*xs] + vp.gp[cx-2*xs-2*ps];
00825             pz.gp[cx] = (sWord)((8*da+4*(db+dc+dd+de)+2*(df+dg+dh+di)+dj+dk+dl+dm)/144);
00826         }
00827     }
00828
00829     return pz;
00830 }